Sheet Linking - Project sheets to single metrics sheet

Hi,
I have about 80+ projects running simultaneously. In each project sheet, I have some basic project information & metrics (duration of each milestone calculated from actual start & finish dates) which needs to be tracked and analysed.
The information & metrics from all projects should be collected in the Metrics sheet.
In the metrics sheet, each row will represent 1 project data.
row#1 == project#1
row#2 == project#2 & so on...
Is there an easier way to do so? Can I use cell linking? Will it be manual work (linking for each project)?
Or do I have to generate report instead of metrics sheet?
I want to create a dashboard from the Metrics sheet which will give an over view of all projects together.
Thank you.
Answers
-
Hi Abhiraj,
It sounds like a Report would be the best way to do this, and much easier than cell linking (which yes, would be manual work).
How is the information displayed in each of your sheets? Would you be able to provide a screen capture showing an example of where the metrics are located in the sheet (but block out any sensitive data in the image)?
-
Hi Genevieve,
Thanks for the reply.
I have attached the screen capture.
The summary data before the WBS is important and against that project, we need to track the actual completion dates and actual duration.
I want duration for each milestone across all the projects and then average of that duration (month on month).
e.g for 20 projects, procurement was completed in MAY, what is the average duration for procurement. So count & duration is important for us.
(I have 80+ projects running at any given point)
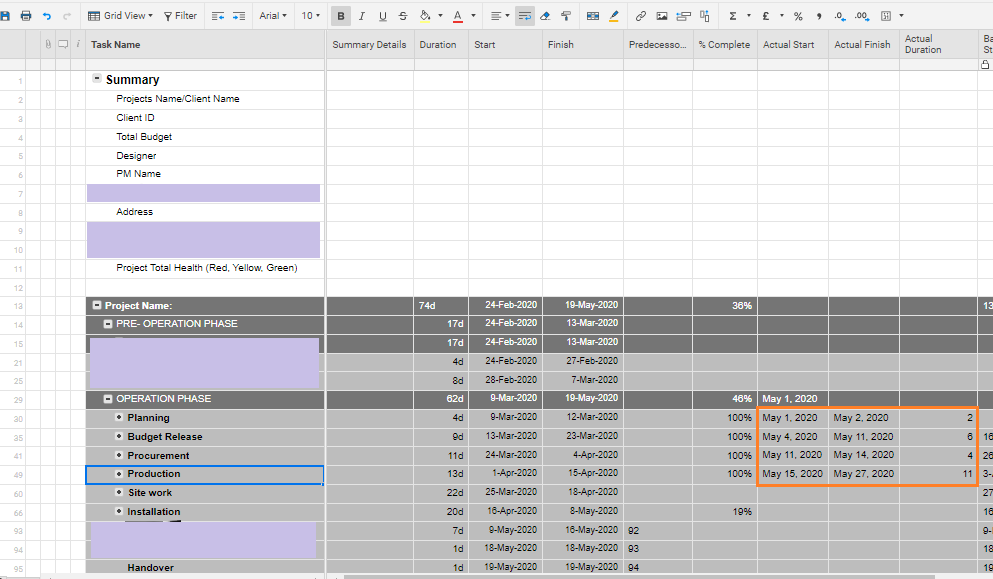
.
Problem with report is I cannot add any columns for that analysis.
-
Hi Abhiraj,
Hmm that does get a little tricky. Any solution I'm thinking of (cross sheet formulas, cell linking, etc) creates quite a bit of work.
I do still think a Report is the best way to go - it won't be fully automated, but it will gather the information for you in a way that will hopefully be easily accessible.
For example, if you select all of your sheets and have the criteria in the Report be that the Task Name is one of the milestones (say "Production"), and the Actual Finish date is in May, it would then bring together all the rows that meet that criteria.
Now, this is where the manual work comes in. If you click on the Duration Column to highlight it in the Report, there will automatically appear a small, grey window with some details for you:

This creates some calculations, but you can't currently copy this or leverage it in dashboards, etc (please submit an Enhancement Request for this!). You would need to manually put in those numbers into your other sheet, when you're looking to update the AVG, etc.
The good think about this is that after you've created one Report you can just Save as New and adjust the criteria to be looking for a different Milestone (so you don't need to re-select all the sheets all over again).
Alternatively, the Pivot App Premium Add-on would be able to achieve what you're looking to do and automate this process for you, see here: https://help.smartsheet.com/learning-track/integrations-and-add-ons/pivot-app
Hope this helps!
Cheers,
Genevieve
-
Hi Genevieve,
Thanks for the suggestions.
I have used sheet summary with formulas for the required metrics and tasks and generated a report for the same.
I still have to manually check the average but I am able to compile the data together as I wanted. Though it won't be in the dashboard.
My task would have been easier if there was an option to link report data to other sheet.
I will check out the Pivot app.
Regards,
Abhiraj

Categories
- All Categories
- 14 Welcome to the Community
- 10.6K Get Help
- 63 Global Discussions
- 67 Industry Talk
- 385 Announcements
- 3.5K Ideas & Feature Requests
- 55 Brandfolder
- 125 Just for fun
- 50 Community Job Board
- 464 Show & Tell
- 40 Member Spotlight
- 44 Power Your Process
- 28 Sponsor X
- 234 Events
- 7.3K Forum Archives
