Report by Resource

I am trying to do a simple report that lists each resource and the projects they are assigned to. I have projects with more than one resource assigned to a project, many project has 2 or 3 assigned. I want to see each resource and what projects they are working on. I tried the resourcing function but it does not really give me what I need lists the resources and projects but only allocations and I want some other info from the project.
I tried a report that reads all my project sheets and I can show a great Gannt chart with all the projects and resources but I need a report that has resource on the left not by projects but by resource.
So I created a master sheet that I have all the projects and I am pulling in data from all of the project sheets into the master metric sheet that shows the project and info and i can but I also need resources. Problem is I can create a report using the group function if there is only 1 resource but I cannot report where there are multi resources in the assigned. I tried creating a separate columns for each resource but then I cannot group them so I cannot report that way either. I really don't want to add 10000 ft as it is a small company and was hoping to do it in just smart sheet. Looking for something like below.
Resource 1 -
- Project 1.. Start date... end date.... other info
- Project 2..Start date... end date.... other info
- Project 3..Start date... end date.... other info
Resource 2 -
- Project 2..Start date... end date.... other info
- Project 4..Start date... end date.... other info
Resource 3
- Project 5
- Project 3
Donna Allen
Best Answer
-
Hi @Donna Allen
Yes, exactly. Each individual Report would look across all of your Projects to gather every single row that this one person is assigned to, across all your project sheets.
Then filter the Report by your resource/person. In this way, the entire Report is one "Group" of every row (even if it's multi-select) that is assigned to that person.
To create a second "Group" with the second resource, create an entirely new Report (with "save as new" so you don't have to start from scratch), looking across all your sheets, but now filter by the second person instead of the first.
Report 1: Resource 1:
- project 1
- project 2
- project 3
Report 1: Resource 2:
- project 1
- project 2
- project 3
In my screen captures above I grouped each Report by Project, but you could keep the full Report as individual rows instead of grouping by anything. Or you could sort them by date, etc.
Does that make sense?
Cheers,
Genevieve

Answers
-
Hi @Donna Allen
As you've found, Reports currently are unable to Group by multi-select columns. The way I would personally report on these resources, keeping all the information in one place, would be to create a Dashbaord; this Dashboard would have multiple Reports embedded as a Web Content Widgets (to show the Grouping).
This way, I can create multiple Reports, one for each resource, using their name as the filter across all of the projects & sheets, then Grouping by Project.
To quickly create all these multiple Reports, I would create a duplicate (using "save as new") to swap out who I'm looking for in the filter and quickly create a second, third, fourth Report.
Once I have all the Reports set up, I would list these in a Dashboard to show a scrolling view of all the resources (by Publishing the Report and using the Web Content Widget).
This way you can see duplicate rows if two people are assigned: one in the first user's Report, then again in the second user's Report, since they're both assigned to that task.
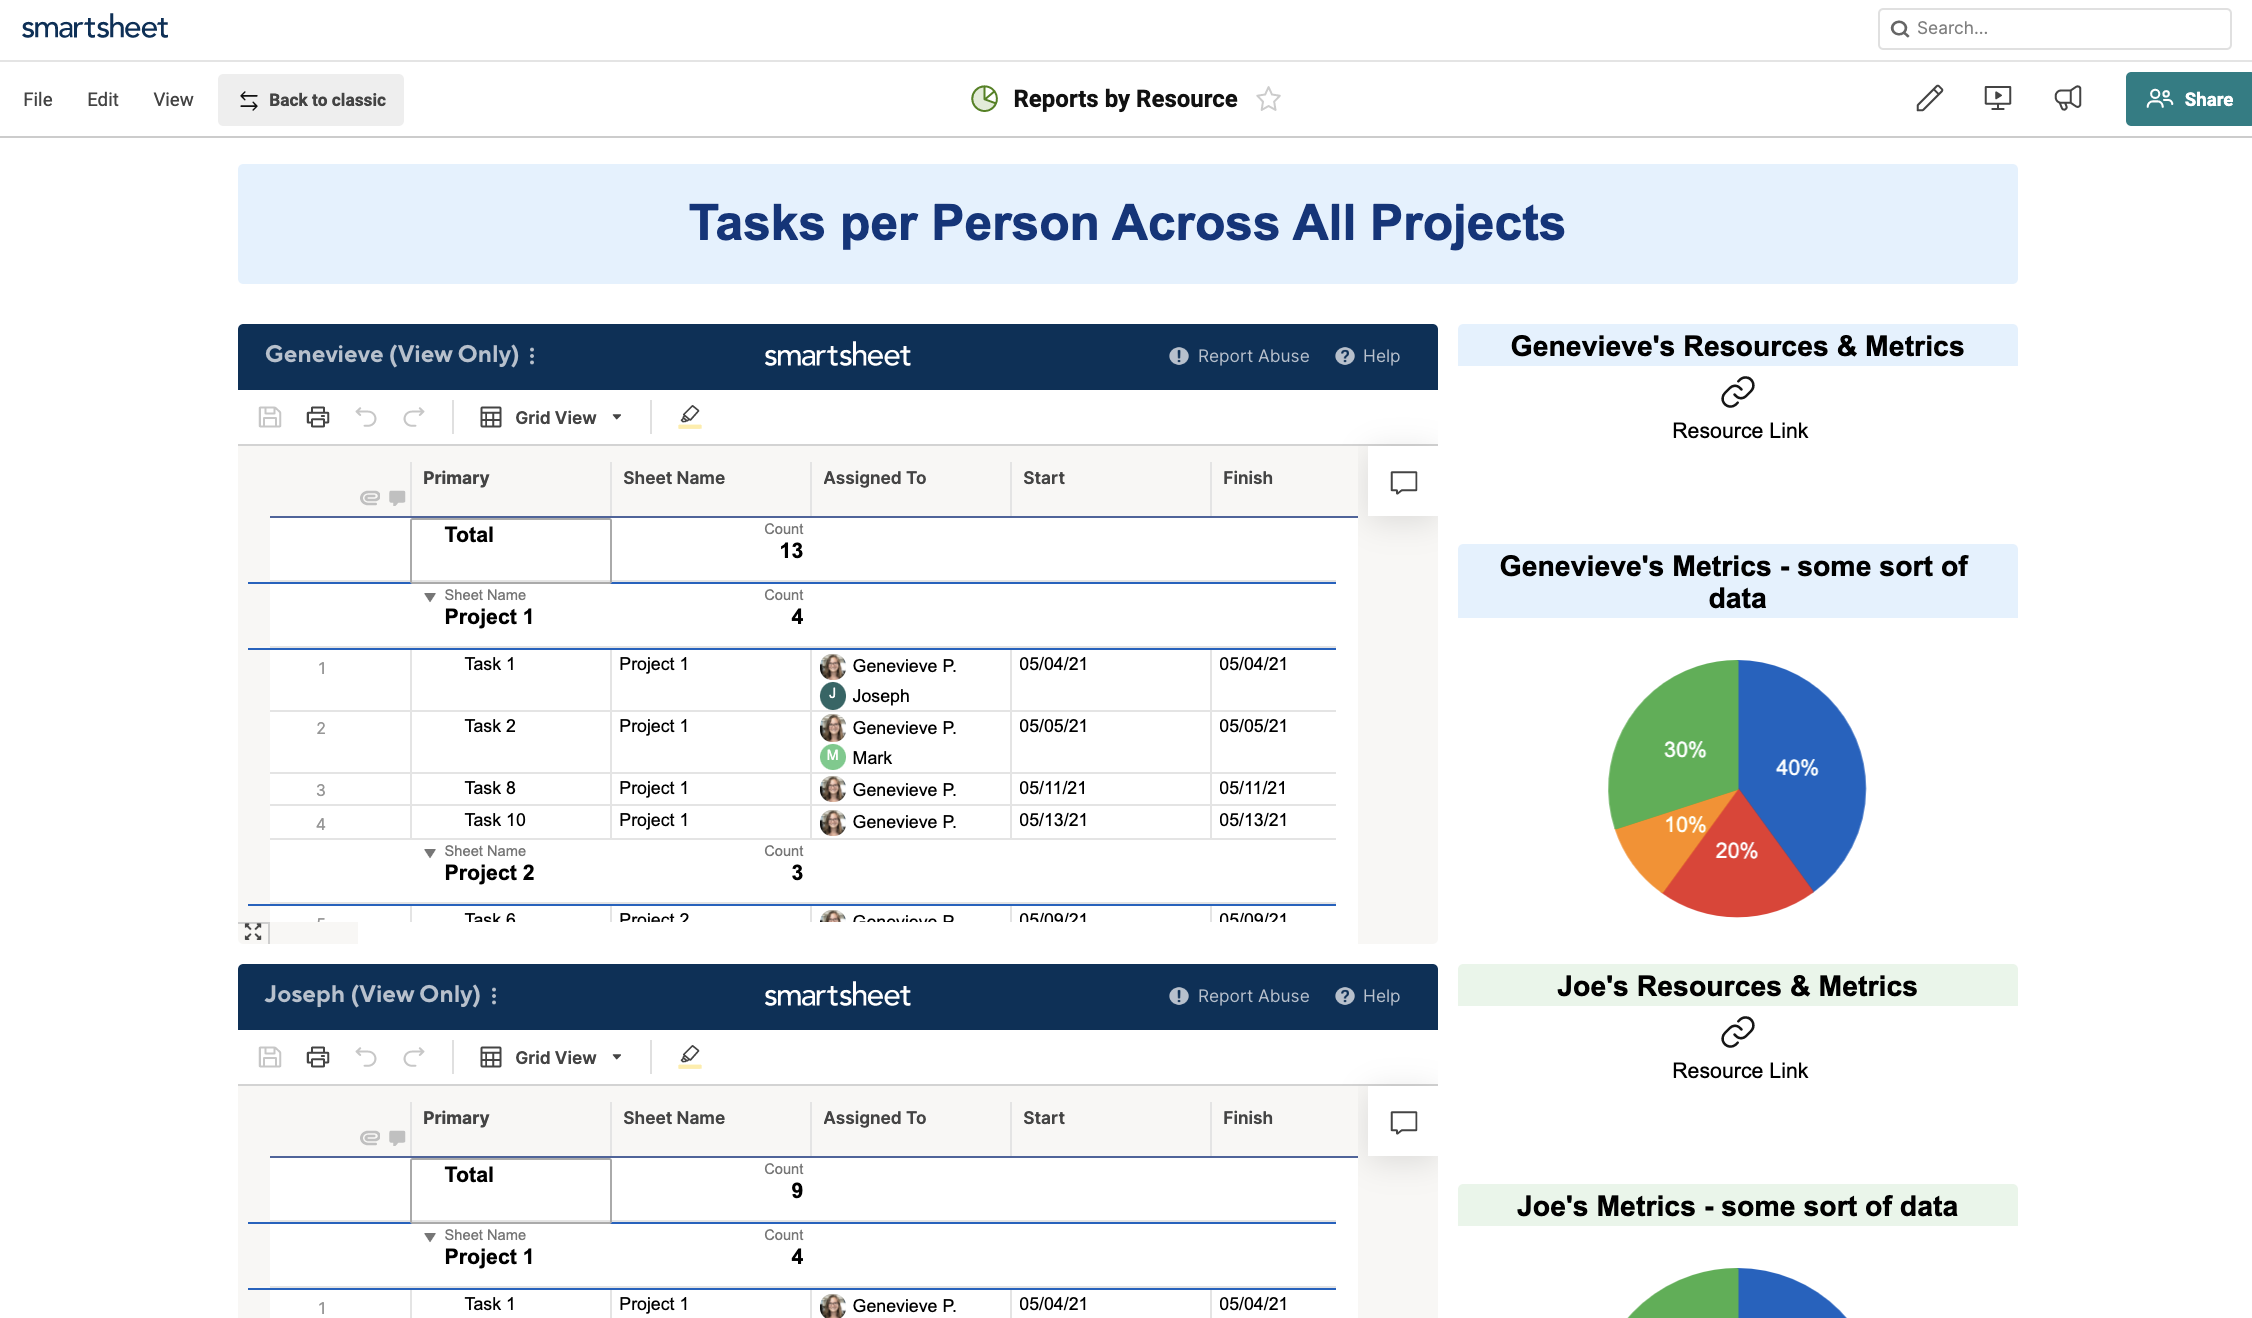
You could have the Report expand out the rows, like above, or you could save the view with the header rows collapsed, to just show the summary per-sheet (and then expand as needed):

Let me know if I've understood what you're looking to do, and if you think this may work for you.
Cheers!
Genevieve
-
Thank you that will work. I wish I could report on multiple resources.
What is the advantage of publishing report and add as widget versus report widget?
Donna Allen
-
Hi @Donna Allen
Yes, exactly. Each individual Report would look across all of your Projects to gather every single row that this one person is assigned to, across all your project sheets.
Then filter the Report by your resource/person. In this way, the entire Report is one "Group" of every row (even if it's multi-select) that is assigned to that person.
To create a second "Group" with the second resource, create an entirely new Report (with "save as new" so you don't have to start from scratch), looking across all your sheets, but now filter by the second person instead of the first.
Report 1: Resource 1:
- project 1
- project 2
- project 3
Report 1: Resource 2:
- project 1
- project 2
- project 3
In my screen captures above I grouped each Report by Project, but you could keep the full Report as individual rows instead of grouping by anything. Or you could sort them by date, etc.
Does that make sense?
Cheers,
Genevieve
-
Thank you
What is the advantage of publishing report and add as widget versus report widget?
Donna Allen
-
The Report Widget provides a cleaner look, so if you're only looking to display the row-level information this is definitely how I would suggest setting up your Dashboard.
However, currently Grouping and Summary features can only be shown when the widget is a Web Content Widget, looking at a Published Report. See the bottom paragraph in this article: Configure Grouping to Organize Results in Report Builder.
-
-
Hi @Donna Allen. Can you share how you created the report that reads all your project sheets to show a Gannt chart with all the projects and resources? I'm trying to do the same, but not quite sure how to do it. Thanks!
-
Create a report and where you select the sheet select all the sheets that you want to use to show the gannt chart. Than depending on what you want to show select the fields in the filter. So if you want to show all the projects and tasks no filter but for example if you want Gannt for current tasks active for each project create a status for each task so on the Gannt I select all the sheets but only the ones that are status "In Progress"

Categories
- All Categories
- 14 Welcome to the Community
- 10.6K Get Help
- 63 Global Discussions
- 68 Industry Talk
- 385 Announcements
- 3.5K Ideas & Feature Requests
- 55 Brandfolder
- 125 Just for fun
- 50 Community Job Board
- 464 Show & Tell
- 40 Member Spotlight
- 44 Power Your Process
- 28 Sponsor X
- 234 Events
- 7.3K Forum Archives
