How to create a monthly reporting chart from summary report?

Hi,
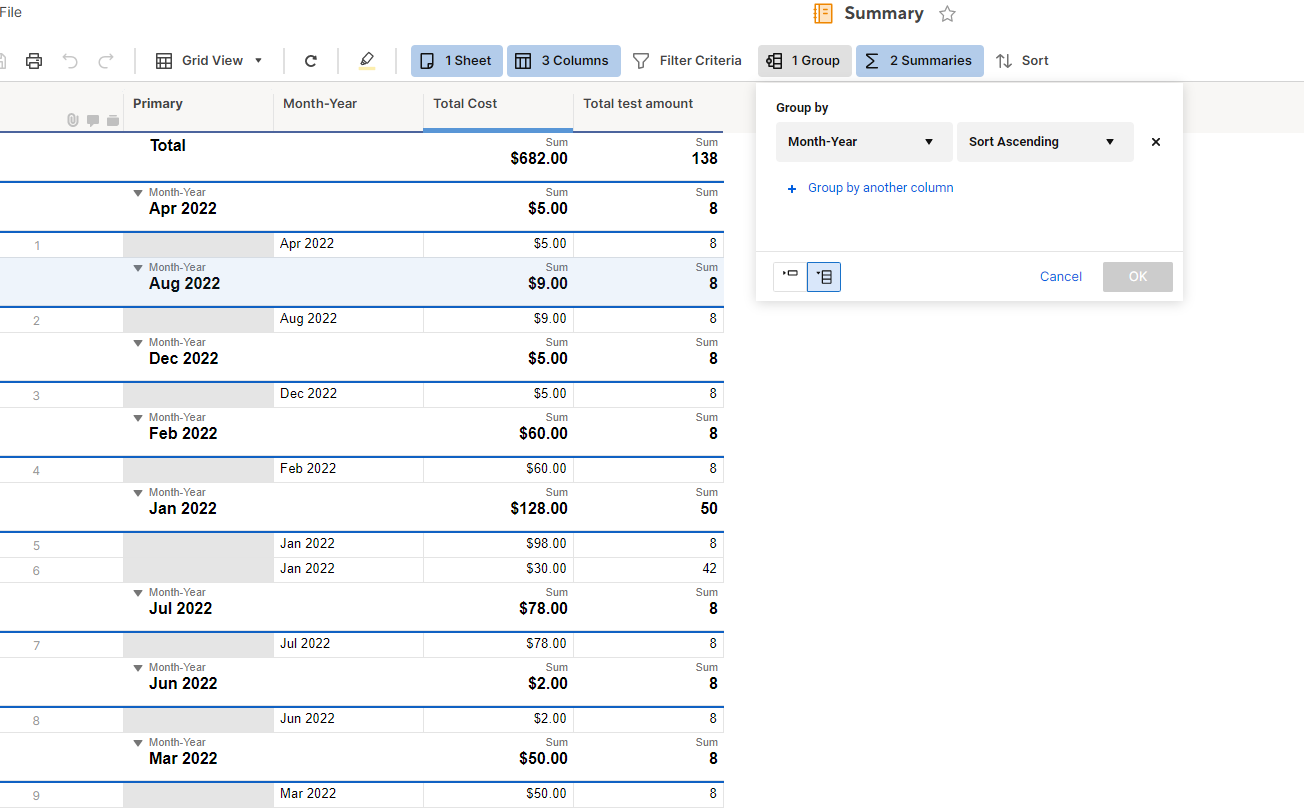
I have created a summary report from my sheet where I've month year, total cost and total test amount. When I'm trying to create a chart without grouping it any additional entry shows up as a new entry in my chart. If I group it then the months does not remain chronological. I'm attaching a snapshot of what the issue is.
Any help is appreciated.
Thanks.
Best Answer
-
Hi @SIS
Grouping on a Text column will Group the data alphabetically, which is why your months are in the wrong order. Are you able to add to that column? I would suggest adding a number at the beginning in order to help the Report Group correctly... ex:
1 - Jan 2022
2 - Feb 2022
Let me know if that would work for you!
Cheers,
Genevieve

Answers
-
Hi @SIS
Grouping on a Text column will Group the data alphabetically, which is why your months are in the wrong order. Are you able to add to that column? I would suggest adding a number at the beginning in order to help the Report Group correctly... ex:
1 - Jan 2022
2 - Feb 2022
Let me know if that would work for you!
Cheers,
Genevieve
-
Thanks, Genevieve!
It worked perfectly =)
Help Article Resources
Categories
- All Categories
- 14 Welcome to the Community
- 10.8K Get Help
- 65 Global Discussions
- 69 Industry Talk
- 385 Announcements
- 3.5K Ideas & Feature Requests
- 55 Brandfolder
- 125 Just for fun
- 50 Community Job Board
- 464 Show & Tell
- 40 Member Spotlight
- 44 Power Your Process
- 28 Sponsor X
- 234 Events
- 7.3K Forum Archives
Check out the Formula Handbook template!