Gannt Chart in Dashboard

I have a dashboard that I've created that is pulling in a report that looks at key activities and dates from a project plan. It is a Gannt chart so users can get the visual of the project status.
The problem I'm running into is that the Gantt chart is being displayed with the earliest date/data from the report. I scroll to the right to move forward in time but I can only go so far. I can click the "open source report to see more" button but would like to have the report default to the end of the project (latest date instead of the earliest date).
Any ideas on how to do this?
Best Answer
-
Did some more digging & it looks like this thread gives me the (unfortunate) answer.
Answers
-
Not sure about getting it to open or default to the end of the timeline, but under project settings you can check the "Open to today's date" box under Timeline Display (snippet here):
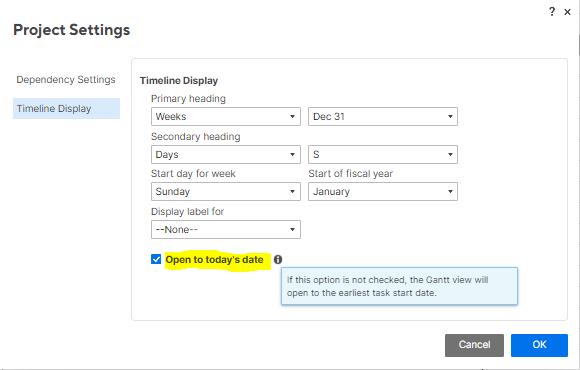
The Gantt tab then starts at the current day and lets you scroll forwards or backwards along the timeline. Not exactly what you're looking for, but a half-way workaround.
-MS
-
That works when looking at the report by itself but when displayed on the dashboard, it starts at the earliest date listed in the report. Here are some screenshots to better explain.
First screenshot: Report view with the correct display thanks to your advice

Second screenshot: Same report but in the dashboard with the incorrect date displayed. I also removed and readded this to the dashboard and got the same result.

-
Did some more digging & it looks like this thread gives me the (unfortunate) answer.

