Creating a Burn Down Chart

Hello,
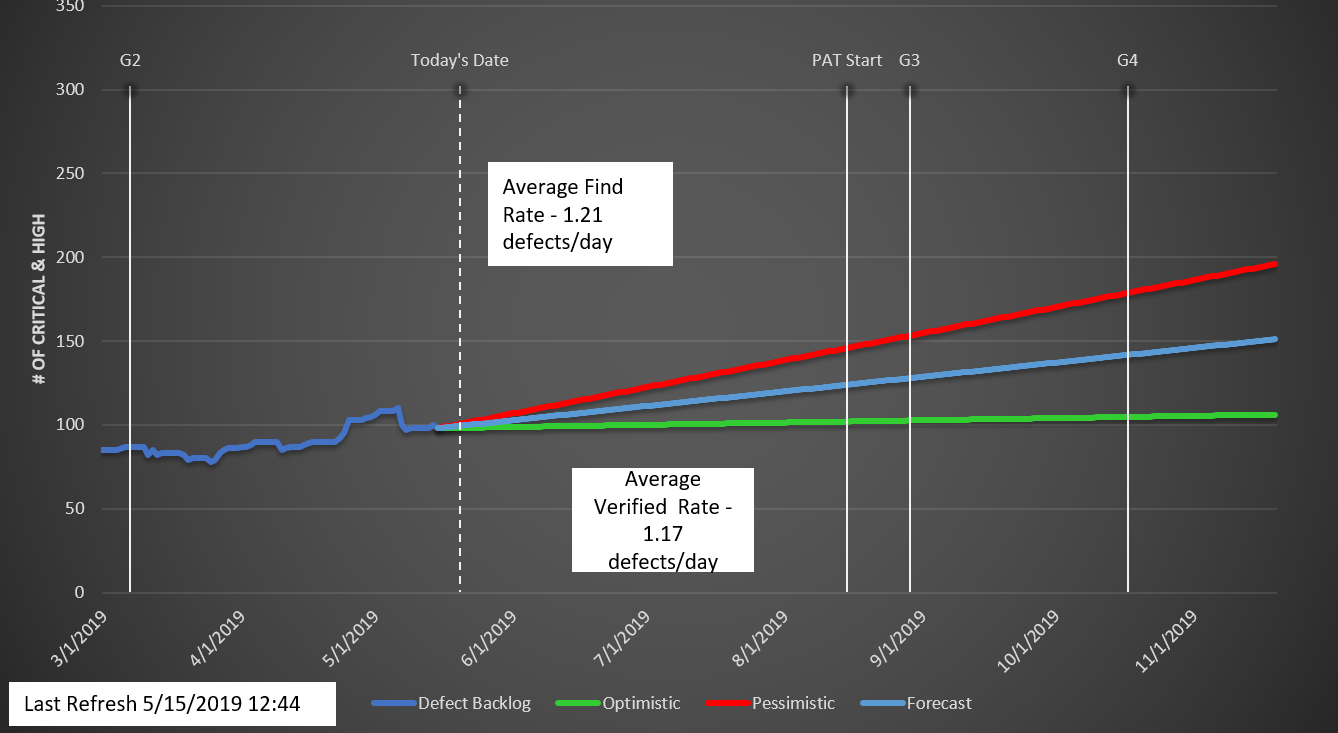
I'm a bit stuck on how, if it is even possible, to create a burn down chart. I'm importing raw data from Jira (we don't have the plug-in... yet) and we want to show a burn down of our defects backlog, along with optimistic and pessimistic and forecast. I'm able to do it in Excel so I've attached an image of something "similar" we'd like to do on a dashboard in Smartsheet.
I've already tried to create a separate spreadsheet with metrics and I tried creating a report but not sure how to even organize the data, if I can.
Comments
-
Hi Kimberlee,
I came across this community post and thought you might find it helpful: https://community.smartsheet.com/discussion/burndown-chart
-
Hi Kimberlee,
How did it go? Did you get it working with the sheets I shared?
Have a fantastic week!
Best,
Andrée Starå
Workflow Consultant @ Get Done Consulting
SMARTSHEET EXPERT CONSULTANT & PARTNER
Andrée Starå | Workflow Consultant / CEO @ WORK BOLD
W: www.workbold.com | E:andree@workbold.com | P: +46 (0) - 72 - 510 99 35
Feel free to contact me for help with Smartsheet, integrations, general workflow advice, or anything else.
-
like this? I got it to work on a dashboard

-
How were you able to create this burndown? Did you use an additional sheet to store the metrics? Also, I was unable to use multiple data metrics in a single chart. Is there a trick to do that?
-
Can you share your sheet? I would like to see how you set this up.
-
Hi Andrée,
Can you share the sheets you shared with Kimberlee, please? I'm also looking to see how burndown charts can be achieved within Smartsheet.
thanks!
-- nancy
-
Hi Nancy,
I'd be happy to share.
Please send me an email at andree@workbold.com, and I'll share them with you.
Have a fantastic weekend!
Best,
Andrée Starå
Workflow Consultant / CEO @ WORK BOLD
SMARTSHEET EXPERT CONSULTANT & PARTNER
Andrée Starå | Workflow Consultant / CEO @ WORK BOLD
W: www.workbold.com | E:andree@workbold.com | P: +46 (0) - 72 - 510 99 35
Feel free to contact me for help with Smartsheet, integrations, general workflow advice, or anything else.
-
Andree, I'd be interested in this sheet as well.
-
I'd be happy to share them with you as well.
SMARTSHEET EXPERT CONSULTANT & PARTNER
Andrée Starå | Workflow Consultant / CEO @ WORK BOLD
W: www.workbold.com | E:andree@workbold.com | P: +46 (0) - 72 - 510 99 35
Feel free to contact me for help with Smartsheet, integrations, general workflow advice, or anything else.
-
I've shared them with you now.
Hope you can use them!
SMARTSHEET EXPERT CONSULTANT & PARTNER
Andrée Starå | Workflow Consultant / CEO @ WORK BOLD
W: www.workbold.com | E:andree@workbold.com | P: +46 (0) - 72 - 510 99 35
Feel free to contact me for help with Smartsheet, integrations, general workflow advice, or anything else.
-
Hi Andrée,
I am trying to get a burndown chart for Smartsheet, Would you be able to share the what you have done here in this post?
Thanks,
Nicole
-
Hi Nicole,
If you email me I'd be happy to share two templates.
Ok?
Best,
Andrée
SMARTSHEET EXPERT CONSULTANT & PARTNER
Andrée Starå | Workflow Consultant / CEO @ WORK BOLD
W: www.workbold.com | E:andree@workbold.com | P: +46 (0) - 72 - 510 99 35
Feel free to contact me for help with Smartsheet, integrations, general workflow advice, or anything else.
-
Hi Andrée,
Would it be OK if I email you to receive the templates as well?
Thanks Alan
-
I'd be happy to share them with you as well!
Please send me an email at andree@workbold.com, and I'll share them.
I hope that helps!
Have a fantastic week!
Best,
Andrée Starå
Workflow Consultant / CEO @ WORK BOLD
SMARTSHEET EXPERT CONSULTANT & PARTNER
Andrée Starå | Workflow Consultant / CEO @ WORK BOLD
W: www.workbold.com | E:andree@workbold.com | P: +46 (0) - 72 - 510 99 35
Feel free to contact me for help with Smartsheet, integrations, general workflow advice, or anything else.
-
Hey Andrée - I am going to email you as well for the burndown sheets. This'll be really helpful!


Categories
- All Categories
- 14 Welcome to the Community
- 10.9K Get Help
- 65 Global Discussions
- 69 Industry Talk
- 385 Announcements
- 3.6K Ideas & Feature Requests
- 56 Brandfolder
- 125 Just for fun
- 50 Community Job Board
- 464 Show & Tell
- 40 Member Spotlight
- 44 Power Your Process
- 28 Sponsor X
- 234 Events
- 7.3K Forum Archives
