Looking for a labor capacity tracking solution - SS Resource options won't work

Hello,
I've seen a few people asking questions that lead me to believe I am not the only person looking for a labor tracking solution NOT at the day level. To use the resource tools in SS we would need people to estimate their workload on a daily basis with start and end dates.
We want people estimating hours per week per project out a rolling 6 weeks. Some projects will have one person working on them, others will have more than one person working on them, no two people will be working on the exact same set of projects at any one time.
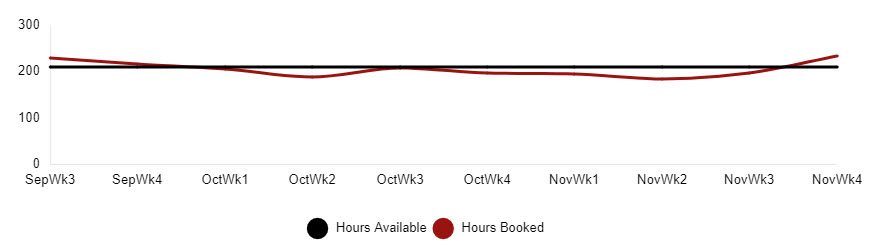
We want to be able to have a dashboard for leadership that will show total hours available and total hours booked by person (all people on one graph), by week, for a rolling 6 weeks (I mocked something up, attached). I haven't found a good way to do "rolling" in SS.
We would also like to be able to list the "top 10" projects by resource hours. It would be nice to have this by week as well, but I haven't gotten definite requirements on that one.
Basically leadership wants to know what people are working on and do we have capacity for more and if so, who has that capacity.
Who has a cool solution?! Or even ideas? I will be at ENGAGE next week.
Andrea Zenner
Program Manager | Infrastructure & Operations
Apogee Enterprises
EAP | Mobilizer | Core Product Certified | Superstar
azenner@apog.com
Comments
-
Hi Andrea,
I'm excited to hear you'll be at Engage this week! You could accomplish all of these things with 10,000ft. I encourage you to stop by the 10,000ft booth to learn more!
-
@Andrea Zenner did you find a solution for this?
-
@Matt Kirby We ended up using different sheets in which each project manager enters the dates and percentage of time each resource is needed on their project. We then use DataMesh to push the information to a master sheet (so if a date or percentages changes we keep track of those).
We are using PowerBI to report off the master sheet.
It's not perfect but it's working for now. It was hard to train users to not delete rows but rather just clear the contents. Deleted rows aren't pushed to the master sheet but if a cell value is cleared that is via DataMesh.
We looked at the Smartsheet Project Management tool, I'm not sure if it is still called 10,000ft or not. It didn't work for our needs. Too clunky from an admin perspective and didn't roll the data up the way we needed it too.
Andrea Zenner
Program Manager | Infrastructure & Operations
Apogee Enterprises
EAP | Mobilizer | Core Product Certified | Superstar
azenner@apog.com
-
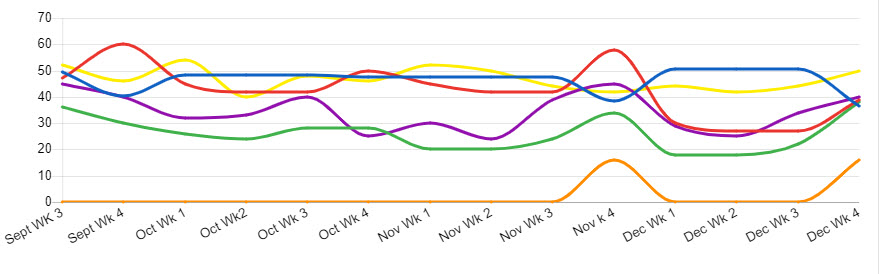
We implemented this in a different way, once we had the data is was easy to show in a dashboard. We have a column for every week in the year and then the user fills in the number of hours requested for that resource for that project. We then use formulas to aggregate the data in whichever way management wants to see it. Below is an example of the "weekly average per resource" graph that we have. We are tracking ACTUALS for the current week and have a defined capacity based on number of resources and average time historically spent on projects. This has worked well for us for 3 years.
I have a similar effort I am starting, but different for tracking another metric (not time) and I want to see historical data (current week and previous 9 weeks before it). I came across your posts hoping there would be a different way then what we have already been doing.

-
Nice solution!
Andrea Zenner
Program Manager | Infrastructure & Operations
Apogee Enterprises
EAP | Mobilizer | Core Product Certified | Superstar
azenner@apog.com


Categories
- All Categories
- 14 Welcome to the Community
- 10.7K Get Help
- 63 Global Discussions
- 69 Industry Talk
- 385 Announcements
- 3.5K Ideas & Feature Requests
- 55 Brandfolder
- 125 Just for fun
- 50 Community Job Board
- 464 Show & Tell
- 40 Member Spotlight
- 44 Power Your Process
- 28 Sponsor X
- 234 Events
- 7.3K Forum Archives
