Report using multiple sheets

Hi...I would like to build a report from 2 sheets. Taking most of the columns/rows from the first sheet "Summary View" and then just one column of data for the color the RYGB color status from the "SP Automation -Internal" sheet. I have tried to add this missing data point into the "Summary View" sheet but I am at the max for sheet references. So I was hoping a report could help bring this information together (like you would with MS Access). The resulting report is formatted correctly to show the column layout coming from the Summary sheet, it is pulling in the Health color correctly, but it is missing the % from the Summary sheet. Is this report view possible?
Thanks for your help!

Comments
-
Hi Ilene,
Not sure I follow!
Have you added the columns you want to see in the report? Can't you see the % Complete as a choice there?
Have a fantastic week!
Best,
Andrée Starå
Workflow Consultant @ Get Done Consulting
SMARTSHEET EXPERT CONSULTANT & PARTNER
Andrée Starå | Workflow Consultant / CEO @ WORK BOLD
W: www.workbold.com | E:andree@workbold.com | P: +46 (0) - 72 - 510 99 35
Feel free to contact me for help with Smartsheet, integrations, general workflow advice, or anything else.
-
Hi Andree,
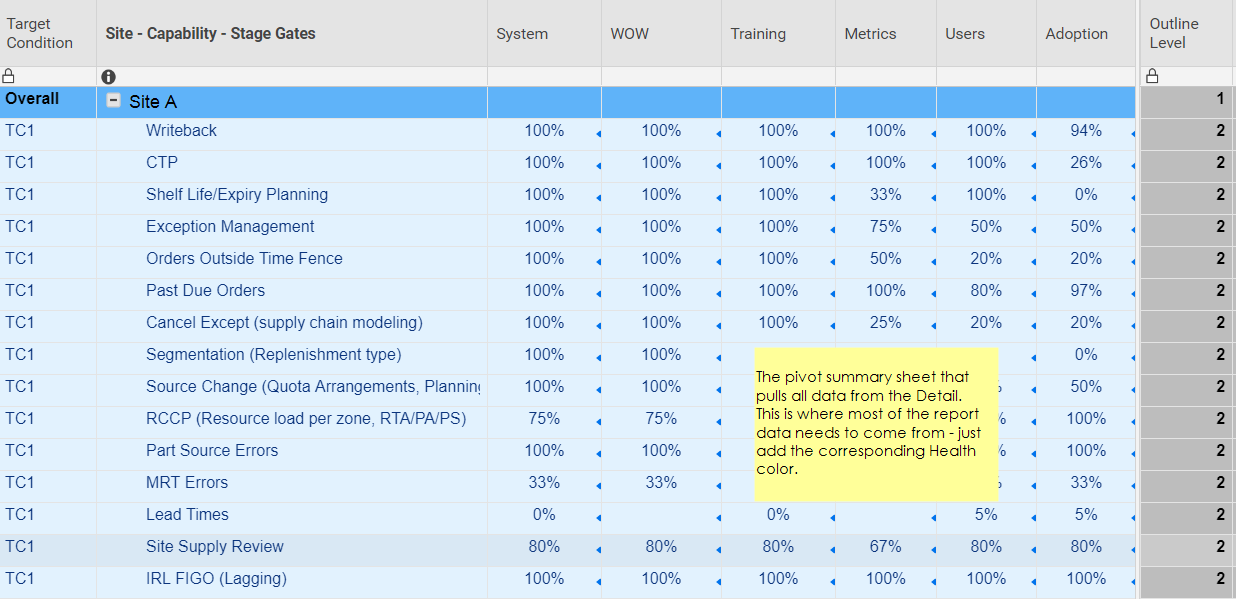
Ideally, I'd like to just add 'heat map' coloring to the "pivot summary" sheet I have. The "pivot summary sheet" pulls (cross sheet reference) in the %complete for each category: System, WoW, Training, Metrics, Users, Adoption. The color coding would be based on the color of the Health dot from the 3 detailed sheets. However, I am at the max for cross sheet references so I can't do that final important step.
As a work around, I was hoping to create report that includes everything from the "pivot summary" sheet and in that format with the categories across the horizontal as columns, and then joins to the 3 detail sheets to add in the color status ball.
When I create or play around with the report I run into two problems:
1) the % do not show in the columns for the categories (System, Wow, etc). It's blank. The color status ball appears but so does each category going down the vertical (as rows) from that particular detail sheet .
Or 2) I can get the % to show correctly and in the categories are in the correct horizontal column format, but the color status balls disappear.
Any way to join these sheets? Or maybe a better way to apply a heat map to the Pivot summary?
Not sure if this helps or hinders, ha.....thanks for any insights.
Thanks
Ilene


-
Happy to help!
Can you maybe share the sheet(s)? (Delete/replace any confidential/sensitive information before sharing) That would make it easier to help. (share too, andree@getdone.se)
Best,
Andrée
SMARTSHEET EXPERT CONSULTANT & PARTNER
Andrée Starå | Workflow Consultant / CEO @ WORK BOLD
W: www.workbold.com | E:andree@workbold.com | P: +46 (0) - 72 - 510 99 35
Feel free to contact me for help with Smartsheet, integrations, general workflow advice, or anything else.
-
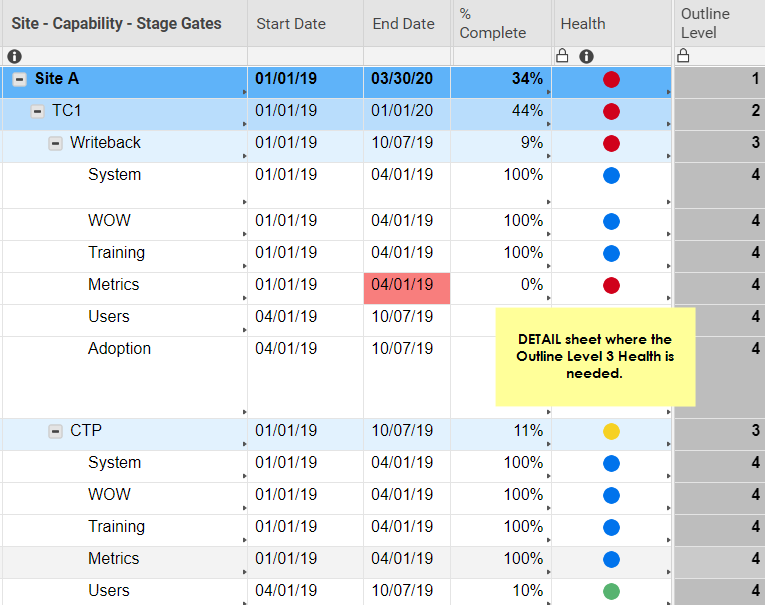
Thank you...will do. I have created test versions and will share. Here they are summarized. The ones highlighted in yellow are the detailed sheets and the one high lighed in green is the summary pivot view....where i have the format correct for what our leaders want to see but I am stuck at getting the heat map colors to shade based on the health of 'system', 'wow', 'training', 'metrics', users', ' adoption' from the details because i am at the max for cross sheet reference.

-
I'll take a look and get back to you!
Best,
Andrée
SMARTSHEET EXPERT CONSULTANT & PARTNER
Andrée Starå | Workflow Consultant / CEO @ WORK BOLD
W: www.workbold.com | E:andree@workbold.com | P: +46 (0) - 72 - 510 99 35
Feel free to contact me for help with Smartsheet, integrations, general workflow advice, or anything else.
-
Did you get it working or do you still need help?
Have a fantastic day!
Best,
Andrée Starå
Workflow Consultant @ Get Done Consulting
SMARTSHEET EXPERT CONSULTANT & PARTNER
Andrée Starå | Workflow Consultant / CEO @ WORK BOLD
W: www.workbold.com | E:andree@workbold.com | P: +46 (0) - 72 - 510 99 35
Feel free to contact me for help with Smartsheet, integrations, general workflow advice, or anything else.

Categories
- All Categories
- 14 Welcome to the Community
- 10.8K Get Help
- 65 Global Discussions
- 69 Industry Talk
- 385 Announcements
- 3.6K Ideas & Feature Requests
- 56 Brandfolder
- 125 Just for fun
- 50 Community Job Board
- 464 Show & Tell
- 40 Member Spotlight
- 44 Power Your Process
- 28 Sponsor X
- 234 Events
- 7.3K Forum Archives
