Best Of
Re: Editable field within workflow before approve or decline
Update Requests can be automated using a workflow / automation the same way an approval workflow / automation is set up. It's just a different action.
 Paul Newcome
Re: NEW! Modern forms submission experience with accessibility enhancements
For all users having issues with the sizing… Smartsheet support simply apologized for the "inconvenience" and told me to start a product idea thread to try to get it fixed, so here it is…
Paul Newcome
Re: NEW! Modern forms submission experience with accessibility enhancements
What's up with the bold font in sheets and forms? When I open an existing sheet, the title it bolded and not very professional looking - the clean look is what I'd like to see. Also, I've looked at a few forms I created and there again is the bolded, unprofessional font. Perhaps it's the browser (Chrome) or may be not. I've tried to change within the form and removed bold from the title just to have it look bolded when opening in a new browser window. Bold is good in some areas - just not every area. Pls bring back the former settings or at least let the owner/admin have the capability of formatting how they wish.
 CarolynD
Advanced permission setting for approval flow
Is that possible to set up the dedicated password before "open request" to enter the approval page?
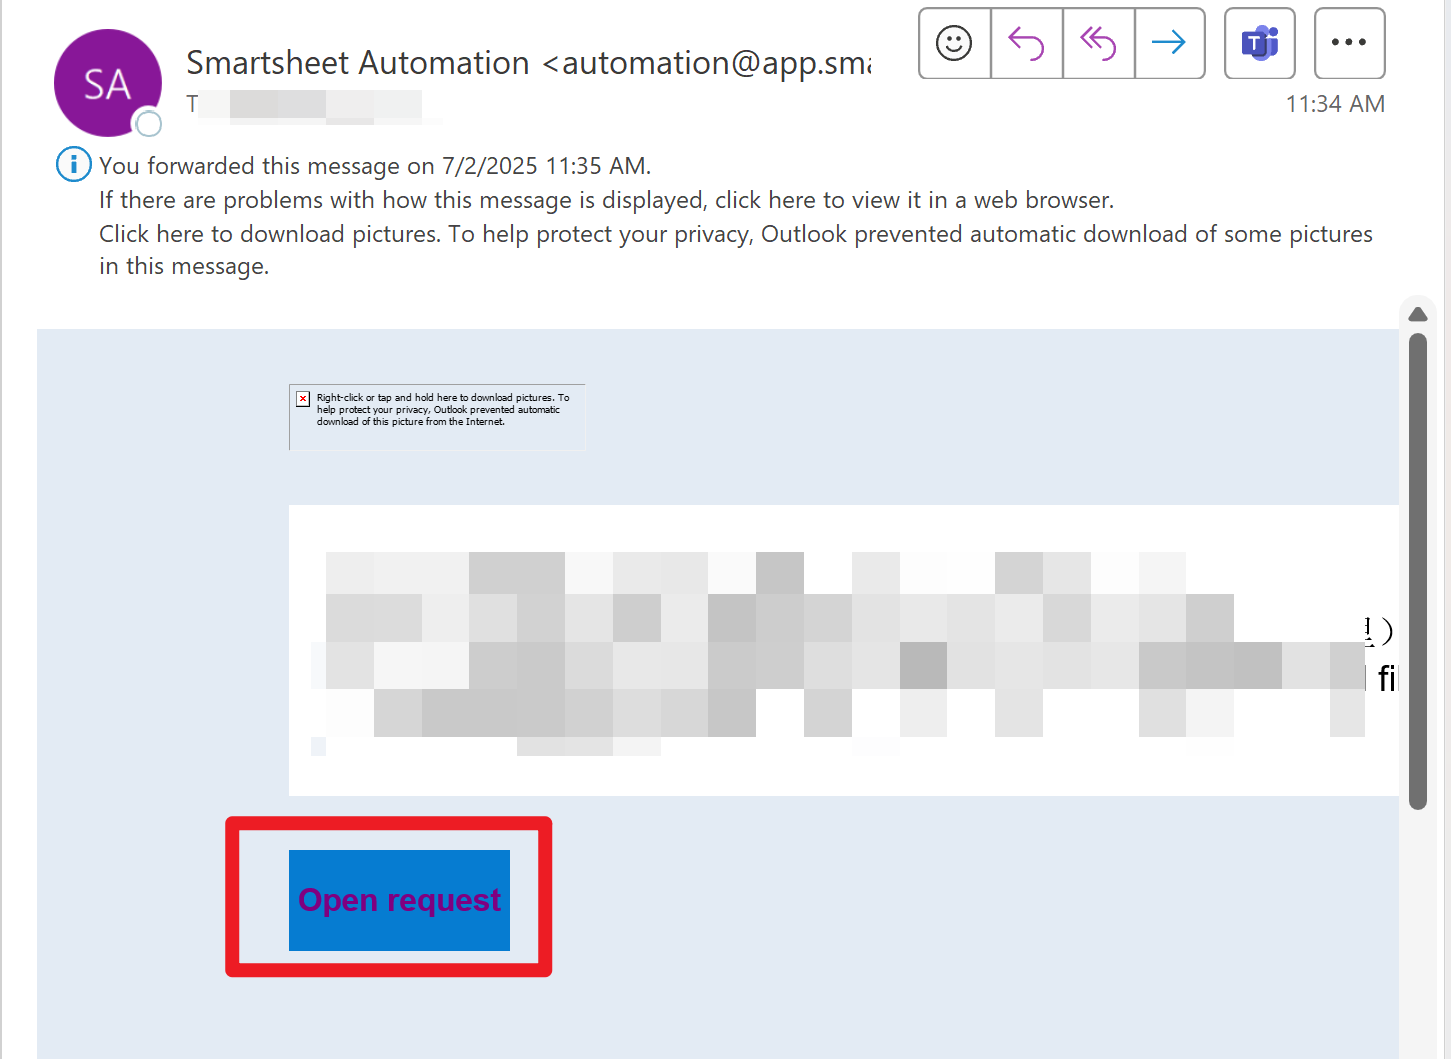
If approver A has received the request and has no permission to open the attachment, he will forward this email to the related party to get the password. In this case, other people such as B may click this link and submit it by mistake once got the link. And Smartsheet will record that "A" has approved this request. How can we prevent this issue occurs by setting a dedicated password?
Yolanda Wang
Re: Column Links Now Generally Available!
I believe that Table view will eventually fully replace Grid view. I just dug through the Table View FAQs on this thread
And I found this:
Is table view replacing grid? Grid view will remain available for the foreseeable future. Once table view fully supports key grid features, it will transition to become the new default experience. Once the majority of our customers no longer utilize grid view, we plan to retire it.
 SSFeatures
Re: How do i make the form labels or help text visible in an email workflow?
Could you give me a screenshot of how this may work? Happy to try and implement on my own sheet if it will do the job :)
 Michael Green22
Sheet Formula to reference DataTable
DataTables work well for their limited purpose. However, to analyze the data you must create a limited sheets from the data then analyze that data, even if all you want is a Sum Total. I would be great to be able to use formulas that reference this data, such as: Sumif(s), Countif(s), Index/Match and others.
 Matt_A
Re: Is there an option to create multiple calendar views to display different column dates?
Thank you Will for the suggestion. I believe I understand where you are going with this but I think my use case is different. I am only looking to show on the calendar a single event on a day. For example, if I have Product A in which I have a column of Ship Date and a Column of Receive Date. I would like a milestone to show up on individual dates instead of a bar connecting the two as many of these will have weeks in-between. I know that Column Master will not be able to have differentiation of Ship Date and Receive Date and would just show Product A but I figured I could address that with some manually formatting but I have not been able to get past the fact that I cannot show two different column milestone dates on the same calendar view.
 Shooter71
Calendar View - Display More than One Date
Is there a way to display more than one date column on a single calendar? I have one sheet with multiple date columns and I'd like to see an entry on the calendar view for each of those date columns, but it looks like you can only view one column at a time.
Bethany Garcia
Deactivate the Share function of AI recommended persons
When sharing a workspace or individual asset, there is a new feature where AI recommends people underneath the box "Invite People and Groups". Is it just our company, or is it 99.9% WRONG in your environment, too? We have over 12k users, and the AI recommendations are an annoying distraction, especially because they are wrong.
At the very least, make this a configurable option either per account or per user to toggle this on/off.
If you agree, please add your vote to support. Smartsheet needs to stop whimsically adding little bells and whistles like this which make noise but add no real benefit . Instead, focus on requested features which have been hanging out there for years.
 DavidB