Best Of
Re: Get Rid of "Workspace" Menu When In Browse
Thanks to everyone in this thread for sharing this feedback. This experience was the result of a bug that has since been fixed. If you are still seeing this experience, please reply in this thread and we can work with you to resolve it.
 Mike Nothum
Re: Introduce yourself & get to know your peers!
Hello! My name is Brooke and I WFH for Lindblad Expeditions as a Field Staff Scheduler. This involves staffing over 15 different ships with naturalists and photographers on expeditions around the world. Originally from New Zealand, I now call Massachusetts home with my husband and two kitties. Hobbies include birdwatching, volunteering, gardening, and anything outdoors!
I am excited to learn more about the capabilities of Smartsheet in order to create interconnected experience for our department.
 BrookeB
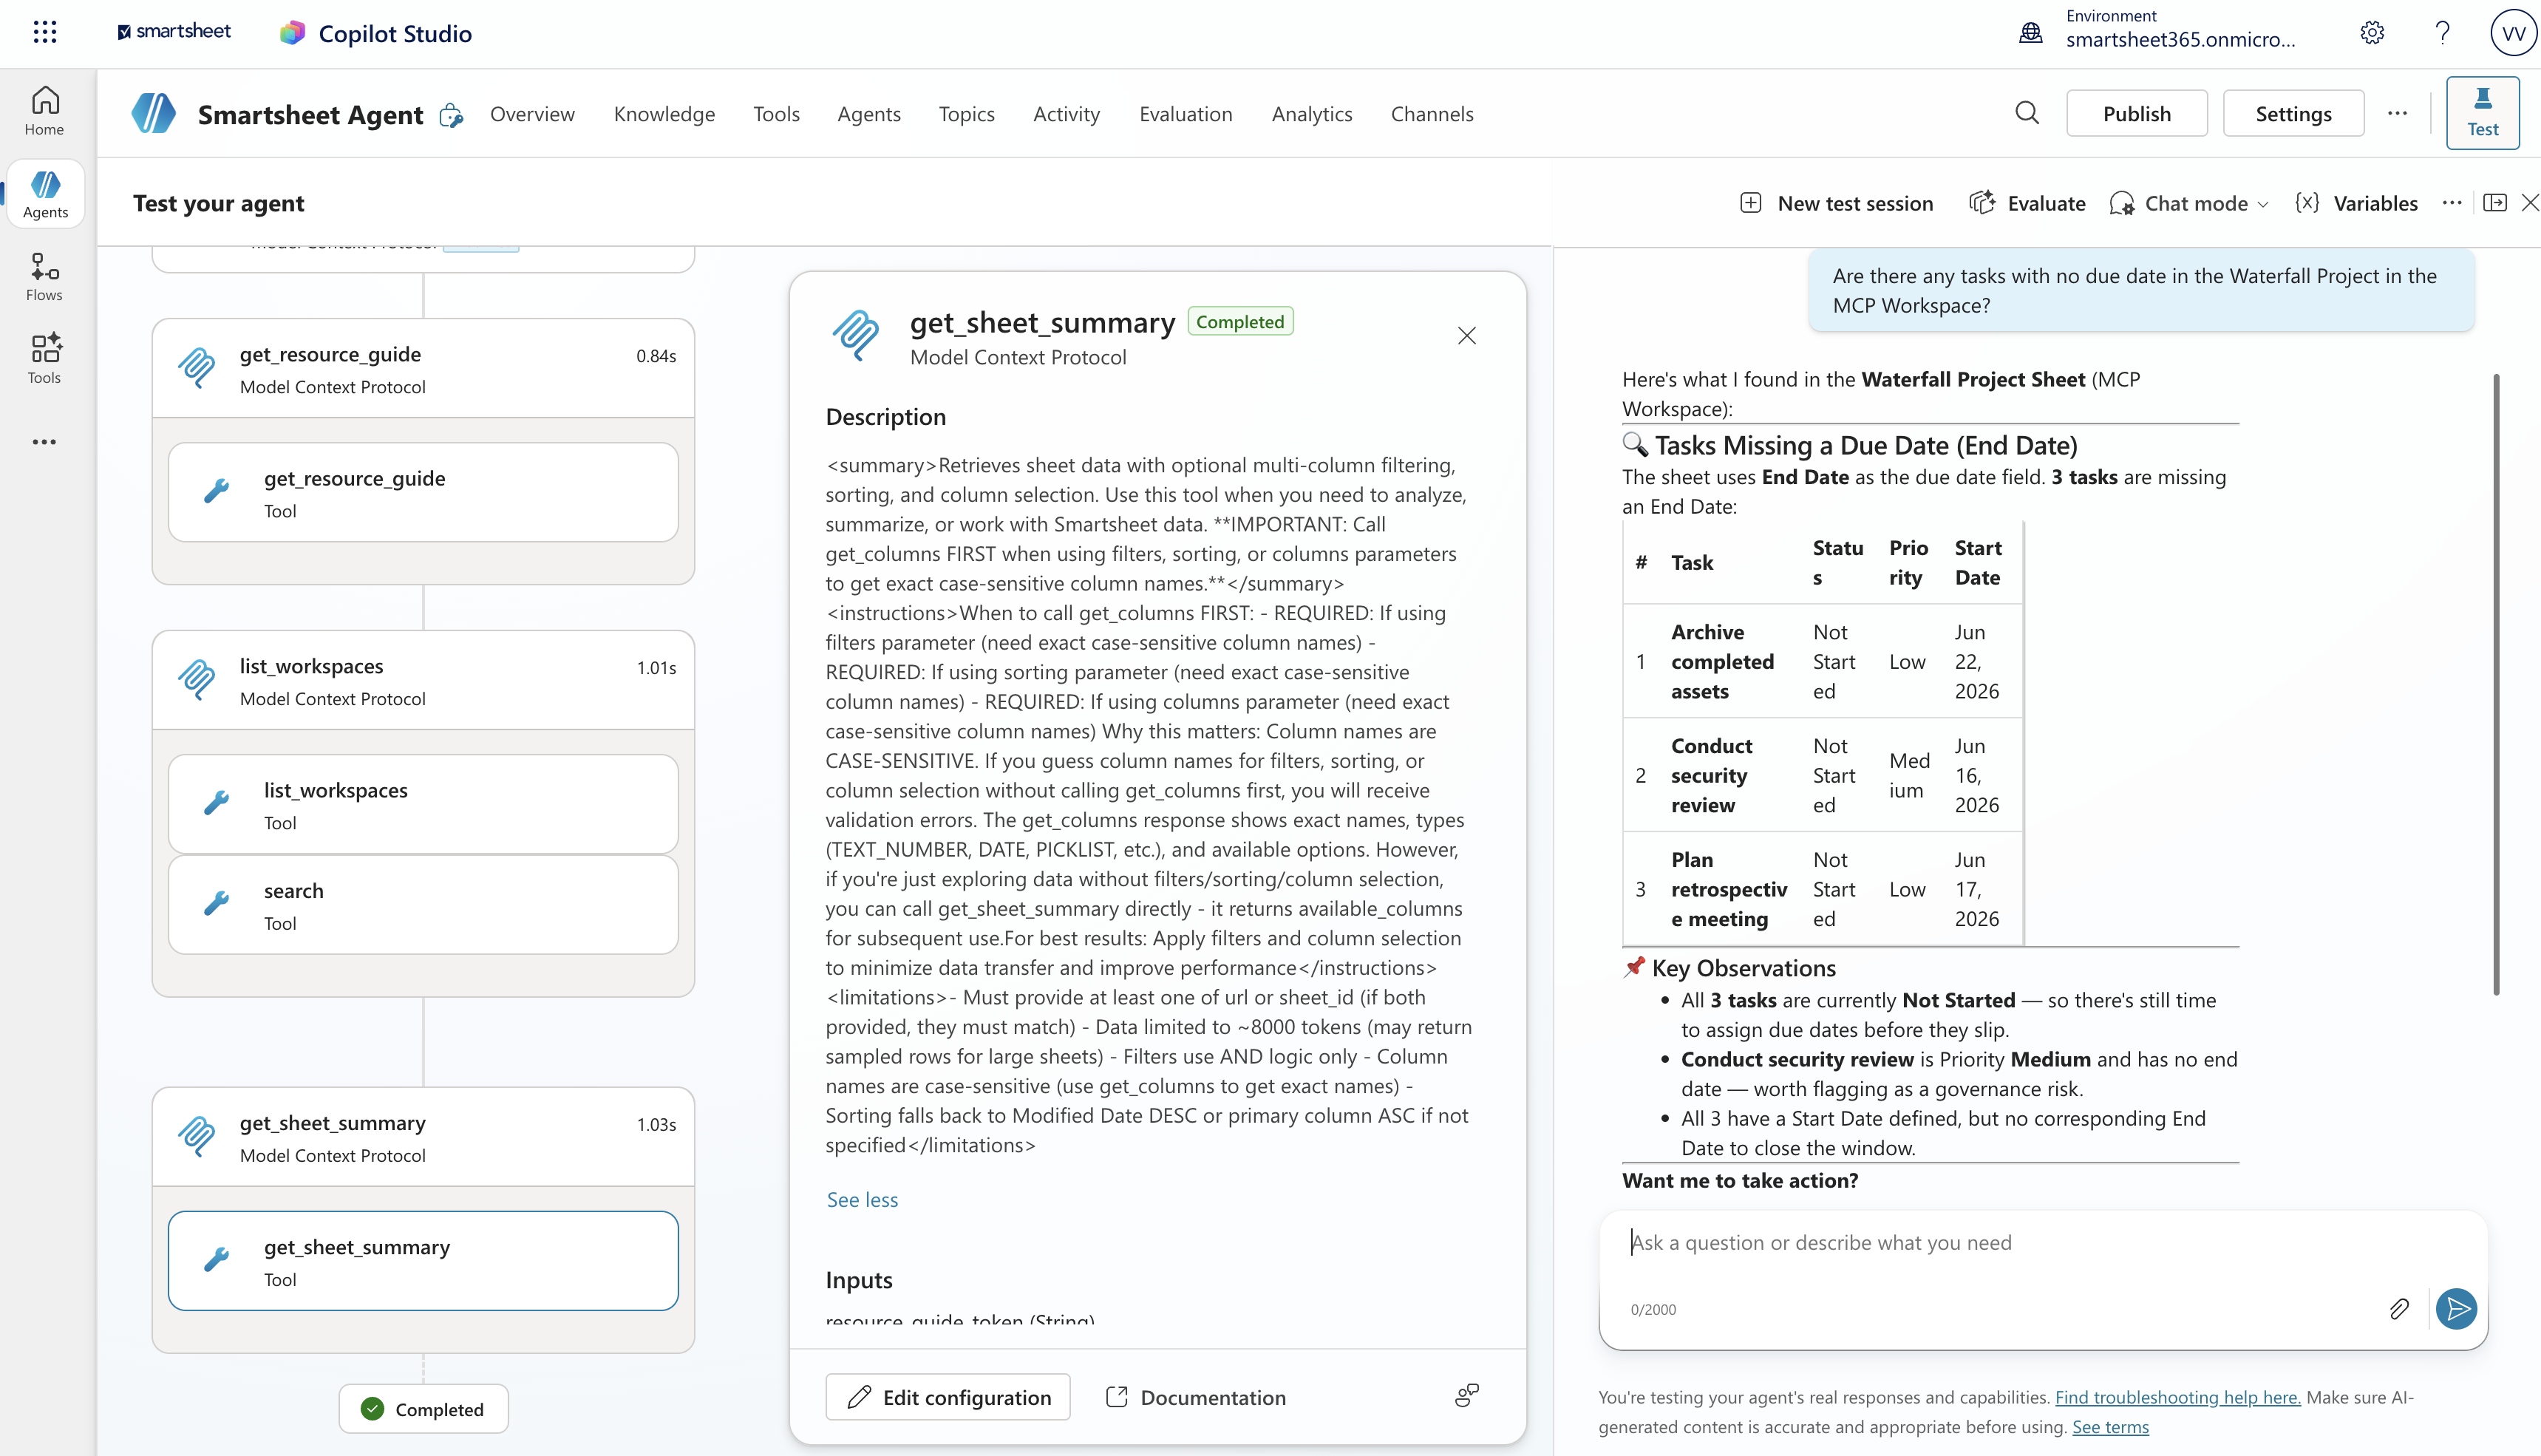
Smartsheet MCP-enabled connector for Microsoft Copilot now available
June 11, 2026
If your team already lives in Microsoft 365, your Smartsheet data is now just a prompt away. We've launched a pre-built, MCP-enabled connector that lets you connect Smartsheet to Microsoft Copilot. Setup is handled once by a system administrator through Copilot Studio, after which the connector is available organization-wide with no per-user configuration required.
Once connected, you can ask Copilot questions like "What are the open risks in my Q3 launch plan?" or "Update all tasks assigned to @james to Complete" and get instant answers and actions from your live Smartsheet data, right in Teams, Outlook, Word, Excel or more. Every response is grounded in real-time Smartsheet data, not a cached snapshot, and every action runs under your own permissions, so Copilot can only see and modify what you already have access to. No exports, no tab-switching, no copying data between tools.
Copilot Studio is where you go further. With the Smartsheet MCP connector as a native tool, you or a developer on your team can compose agents that would have required months of custom engineering two years ago. A Project Health Agent can monitor a portfolio of sheets, identify slipped statuses or missed deadlines, post a digest to a Teams channel, and write back, updating a row, triggering a Smartsheet automation, or escalating a priority. Built in an afternoon, not a sprint. No additional licensing or infrastructure required.
This connector is powered by the Smartsheet MCP Server, the same foundation behind our Claude, ChatGPT and Gemini connectors, bringing the same tools and capabilities into the Microsoft ecosystem. Learn More.
Note: Setup requires Microsoft Copilot Studio admin access. The Smartsheet MCP connector for Microsoft Copilot is currently available in preview — to access it, users must sign up for the Microsoft preview program
Environment Availability: Commercial US, coming in early July: Commercial EU, Commercial AU
Plan Availability: Business, Enterprise, AWM
Subscription Model Availability: Legacy model and user model
Stay informed by Subscribing to receive product release updates for curated news of recently released product capabilities and enhancements for the platform of your choosing, delivered to your inbox. As new releases occur, you will receive a weekly email with news of what's released every Tuesday.
 Galina Jordanowa
Re: Retrigger an intake form
Thank you, I did not know that you could specify a row, I was hesitant to run it thinking it would send messages to all my project sponsors.
 RKMACK
Re: Mobile App
Hi,
I hope you're well and safe!
Strange!
If you haven't already, submit a support ticket through the new Smartsheet Support Portal.
I hope that helps!
Be safe, and have a fantastic day!
Best,
Andrée Starå | Smartsheet Expert Consultant & Partner / CEO @ WORK BOLD
✅ Did my comment/answer help? Please support with 💡 ⬆️ ❤️ ✅ so others find it. Thank you! 🙏
 Andrée Starå
Re: Retrigger an intake form
Hey @RKMACK
Just jump into your automations, select the 3 dot menu, and hit 'run now'! You can then specify if you want to run it for the whole sheet or specific rows.
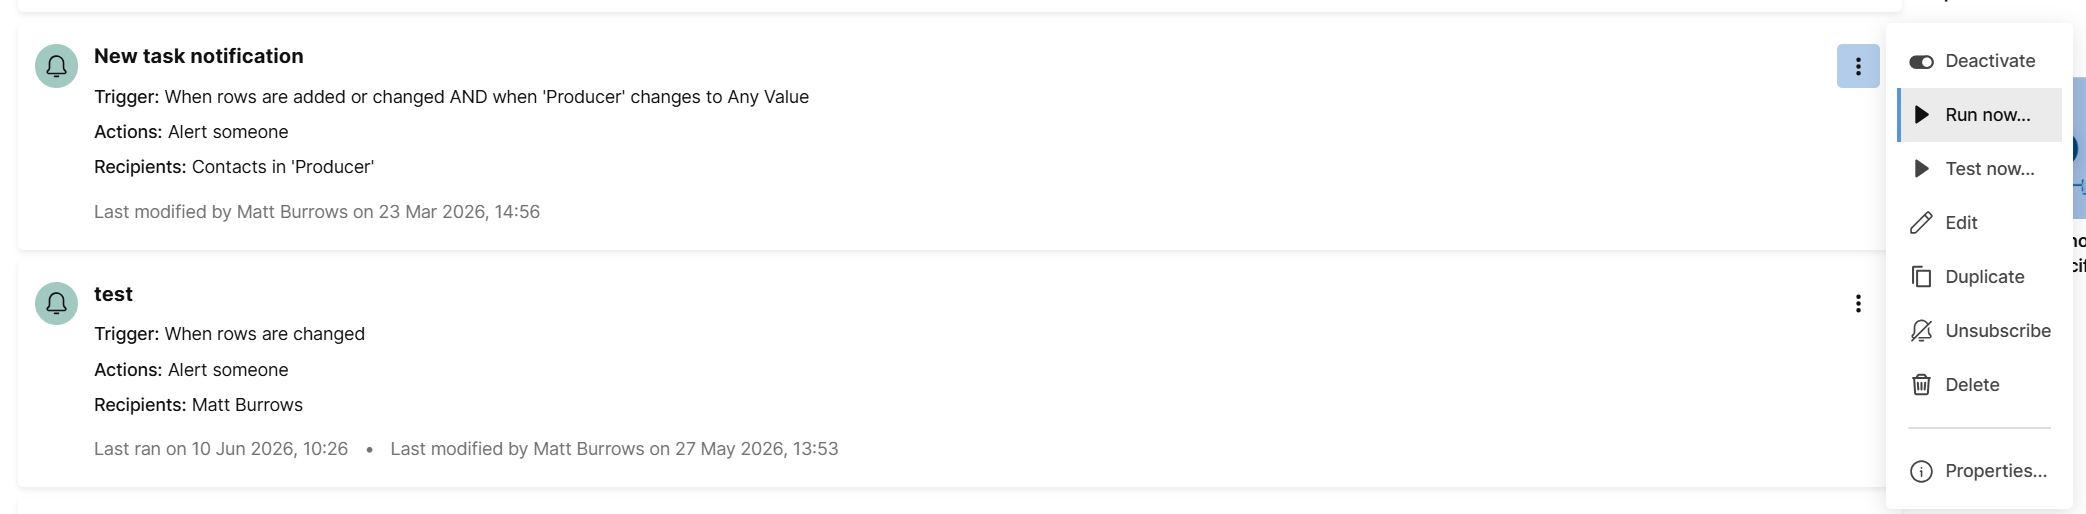
Let me know how you get on.
Matt
 darkmatter
Re: Formula help required
@darkmatter I'm most of the way there for my template scenarios (may not work for all edge cases). Do you have a list of project names, or are they going to be new each time?
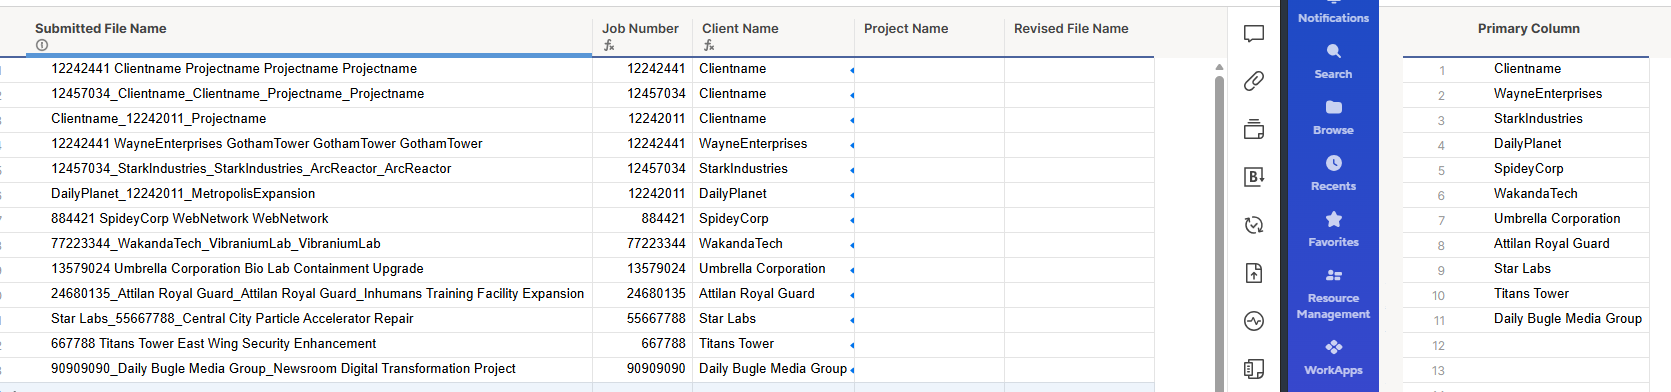
Job Number:
=IFERROR(VALUE(LEFT([Submitted File Name]@row, 8)), IFERROR(VALUE(LEFT([Submitted File Name]@row, 6)), IFERROR(VALUE(MID([Submitted File Name]@row, FIND("_", [Submitted File Name]@row) + 1, 8)), IFERROR(VALUE(MID([Submitted File Name]@row, FIND("_", [Submitted File Name]@row) + 1, 6)), IFERROR(VALUE(MID([Submitted File Name]@row, FIND(" ", [Submitted File Name]@row) + 1, 8)), IFERROR(VALUE(MID([Submitted File Name]@row, FIND(" ", [Submitted File Name]@row) + 1, 6)), ""))))))
Client Name:
=IFERROR(INDEX(COLLECT({Job-Client-Project Client List Range 1}, {Job-Client-Project Client List Range 1}, CONTAINS(@cell, [Submitted File Name]@row)), 1), "")
Once you've got everything separated, you can just concatenate the final list however you want. It'll just come down to whether you can reference a project name list the same way you did the client name or if you need to extract the remaining text once you remove the job number and client name text.
 S.Stone
Re: Smart Sheet Forms - Can no longer delete or Duplicate Forms
Hi all,
As we all know, Paul has incredible deduction skills! There was indeed a temporary issue impacting only forms with long titles, where the Duplicate/Delete options were missing.
This has now been fixed! All forms, including ones with long names, should show all options.
Cheers,
Genevieve
 Genevieve P.
Re: Smartsheet MCP-enabled connector for Microsoft Copilot now available
This is exciting news. I have asked my IT team to review activating this for us. I am keen to see how others progress with this. I am so excited to start using it. I loved seeing @Michael Loughrey demonstration at the Sydney Summit.
 Amy Munro