Connect with peers, share your expertise, and inspire what’s next in Smartsheet — from proven practices to practical how-to insights from fellow users and product experts.
Sign in to see the current vote count, add your own vote, or leave a comment.
I suggest creating a network diagram view to visually see critical chain tasks.
Hi, I was using a lot the relationship diagram in Microsoft project, to visualize dependencies. Is there a plan to implement something similar ? See screenshot below, the relationship diagram would show what is before and what is after the selected task, allowing to easily view dependencies along with their row number. Very helpful on a big project.
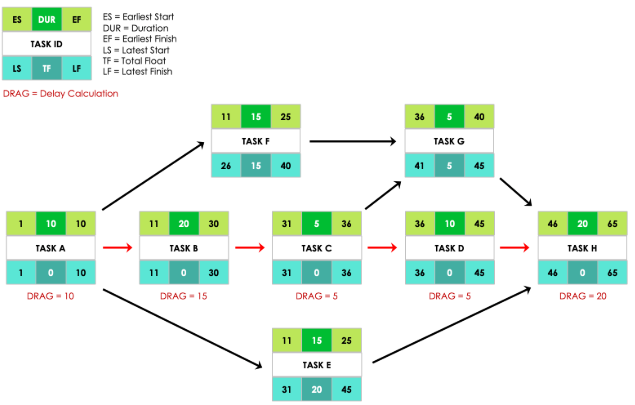
We would like to have a PERT Diagram view in Smartsheet. This diagram allows to have a visual representation of the tasks, their dependencies, and the calculation if the Critical Path.
The ability to add/edit tasks and dependancies in this view would be very helpful. Currently we use other software for network diagrams and transcribe them into Smartsheet.
Even a simplified network diagram view (task, duration, total float) without the additional calculations would be helpful.
Sign in to comment or add your vote.