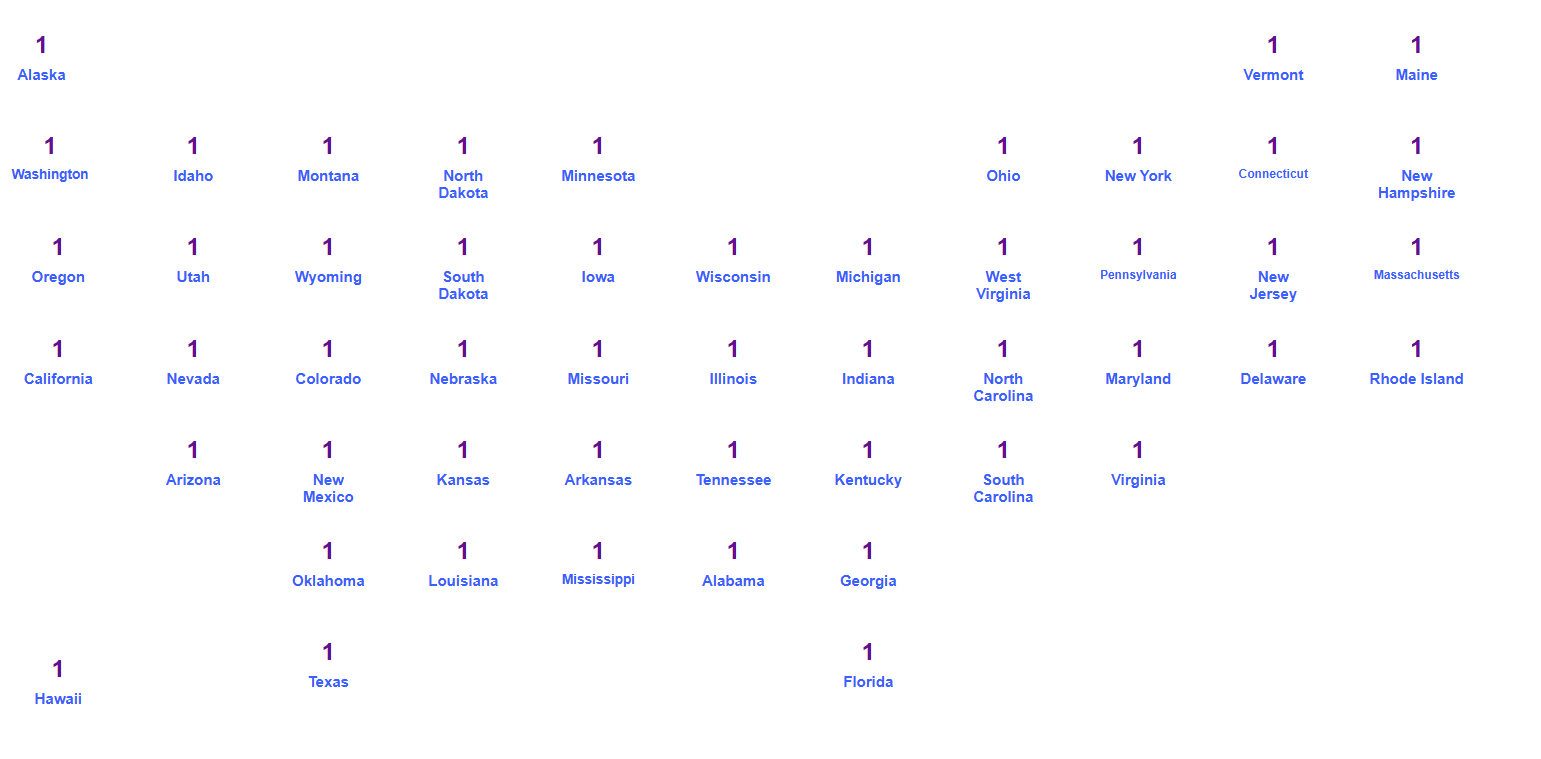
It would be nice to have a graphic in dashboard that you can over lay metrics. Example, a map and then have key points were you can overlay the metrics on each state. This would allow the dashboards to be more visually appealing. I did create a map in Smartsheet but each State is a metric widget. Its not that graphically represented but it did do the job of what I was trying to achieve.