I suggest creating a network diagram view to visually see critical chain tasks.
Sign in to see the current vote count, add your own vote, or leave a comment.
Hi, I was using a lot the relationship diagram in Microsoft project, to visualize dependencies. Is there a plan to implement something similar ? See screenshot below, the relationship diagram would show what is before and what is after the selected task, allowing to easily view dependencies along with their row number. Very helpful on a big project.
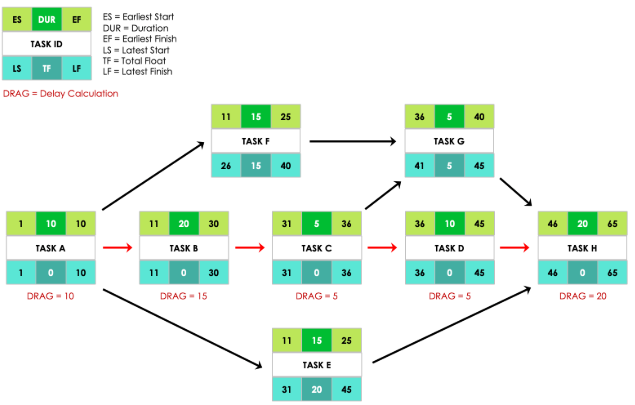
We would like to have a PERT Diagram view in Smartsheet. This diagram allows to have a visual representation of the tasks, their dependencies, and the calculation if the Critical Path.
The ability to add/edit tasks and dependancies in this view would be very helpful. Currently we use other software for network diagrams and transcribe them into Smartsheet.
Even a simplified network diagram view (task, duration, total float) without the additional calculations would be helpful.
It would be extremely beneficial to have the ability to manually assign colors to individual projects within the Timeline View. Currently, project colors are automatically determined by the Dashboard Theme, which limits flexibility and makes it challenging to visually differentiate projects in a meaningful way. Allowing…
It would be useful if users who clicked a Dynamic View link (that they were not previously added to) could "request access" to the Dynamic View, and provide a reason, so that the admin can easily grant that access. The use case for me would be to avoid having to pre-populate and then maintain a user group of viewers, but…
As the smartsheet admin for Europe, it would be extremely helpful to be able to view all Automations / recurring emailed reports in one place as opposed to sheet level. It's almost impossible to ensure everything is working correctly / delete recurring emailed reports without this.