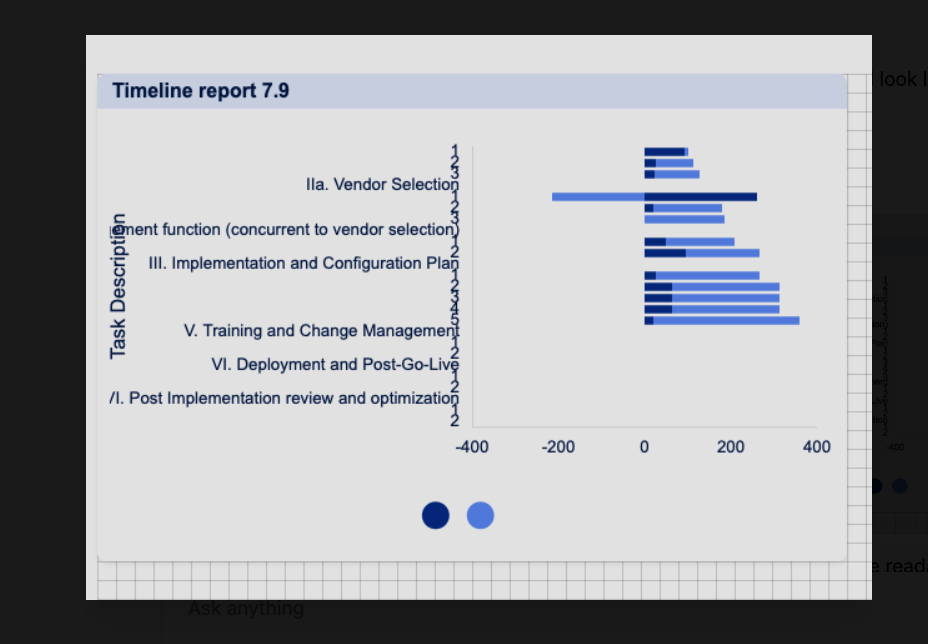
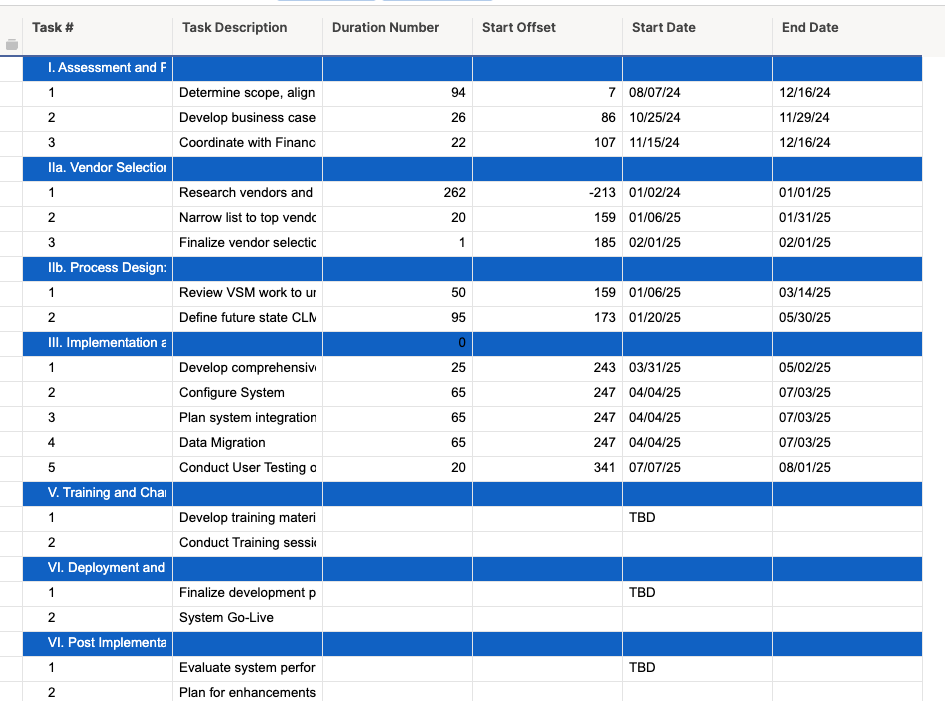
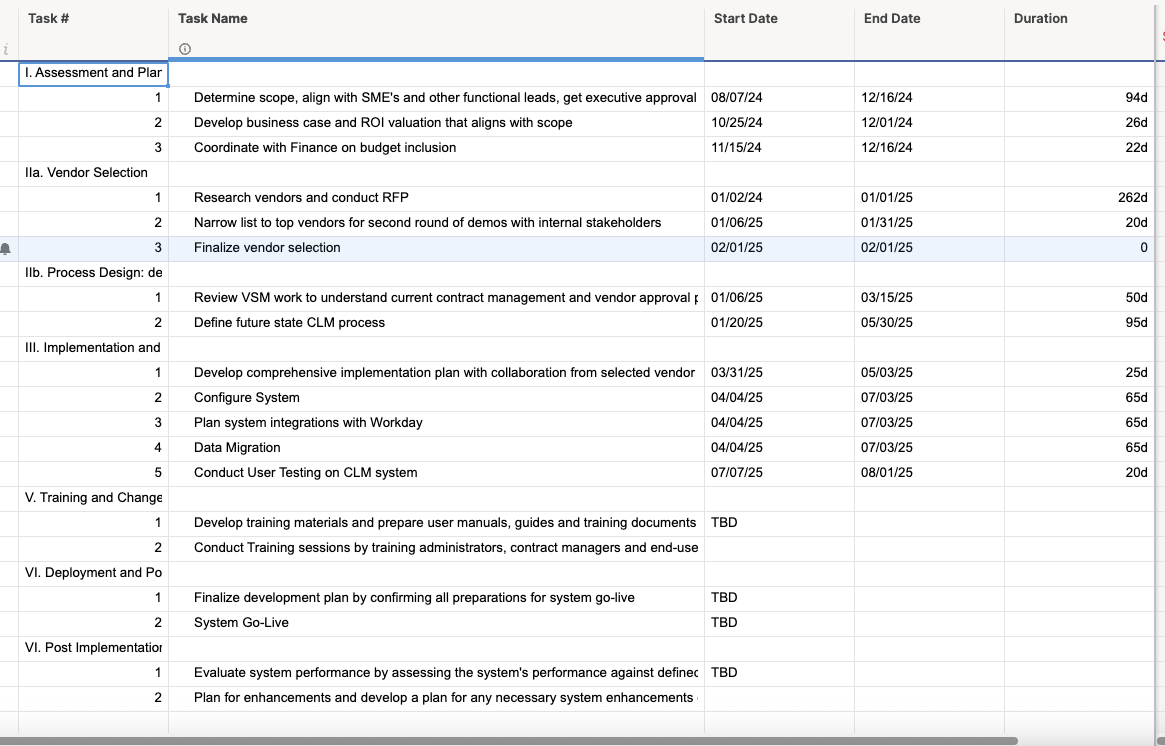
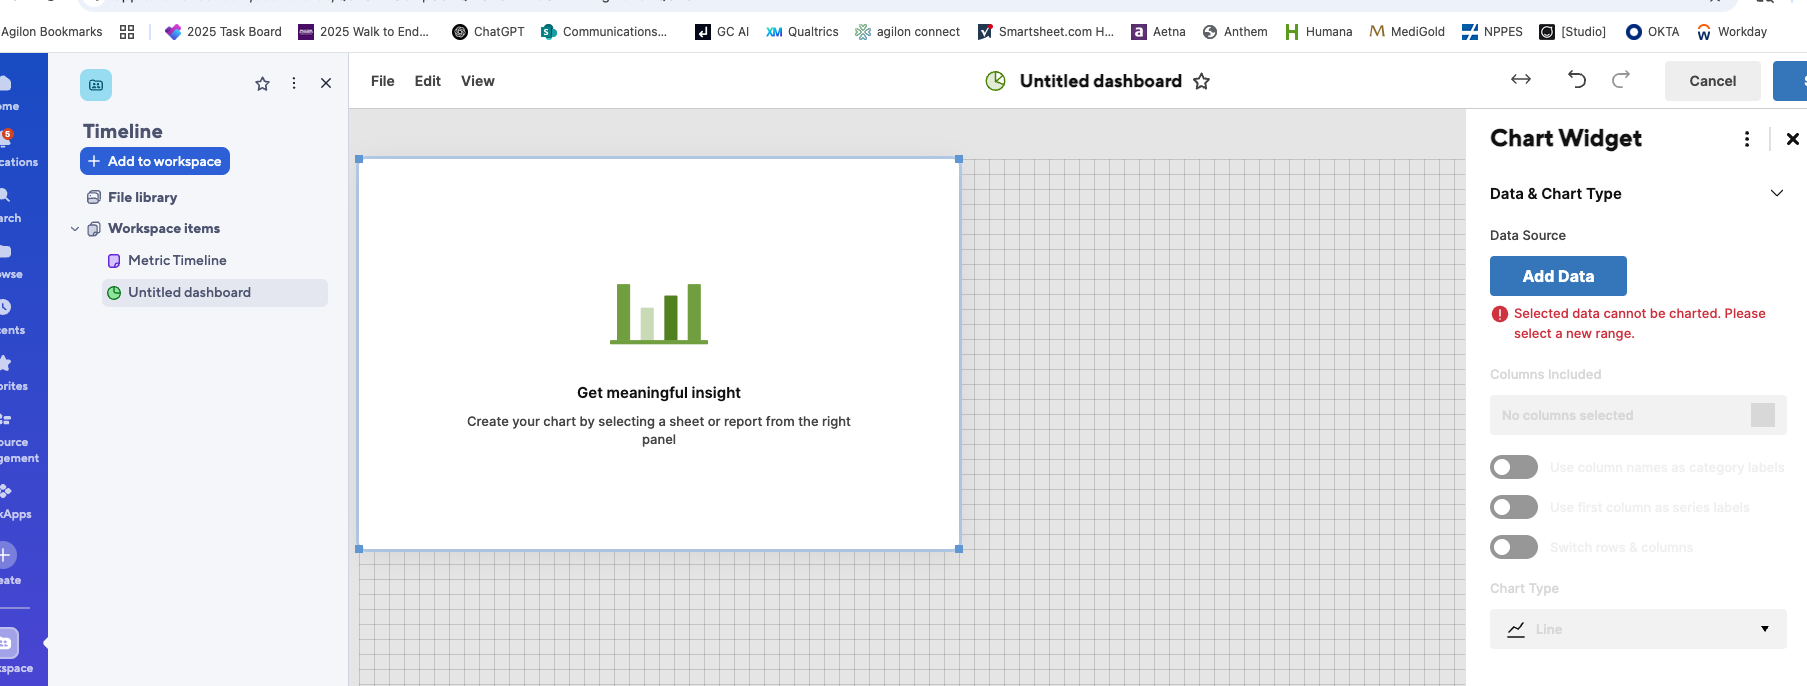
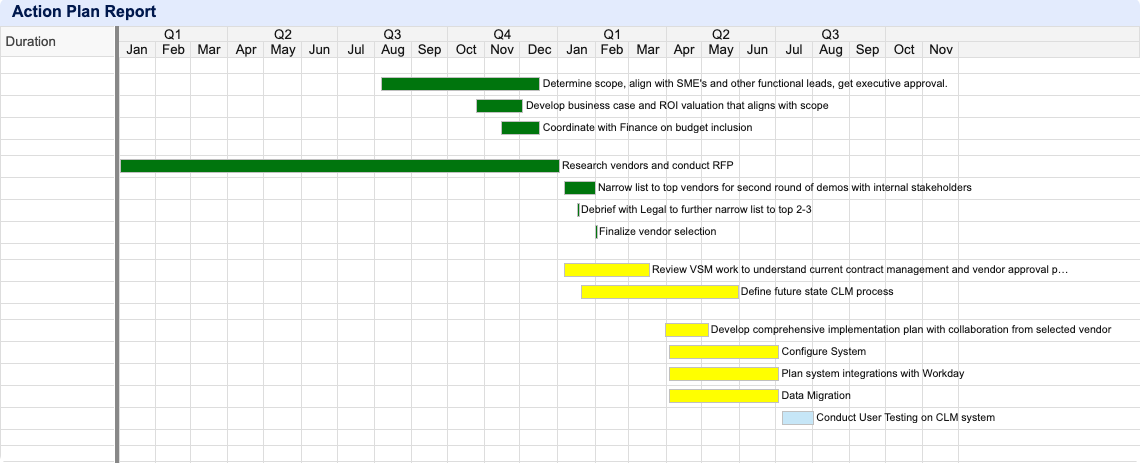
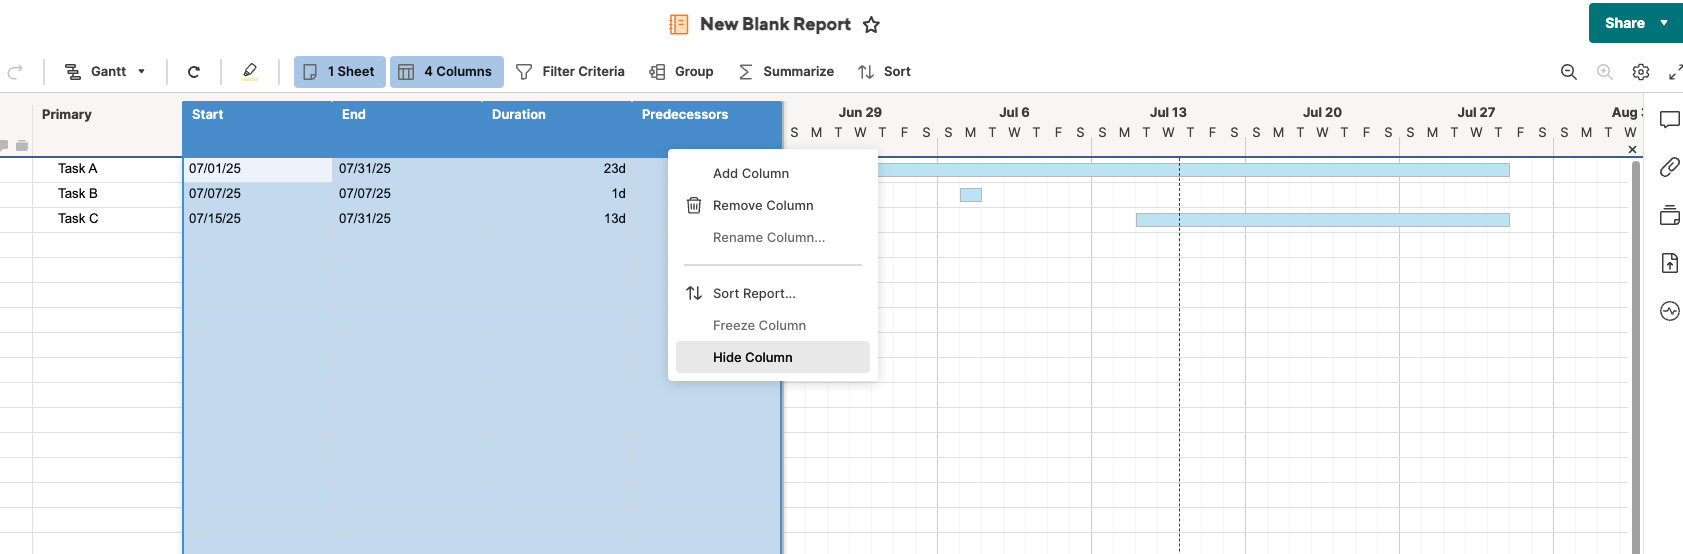
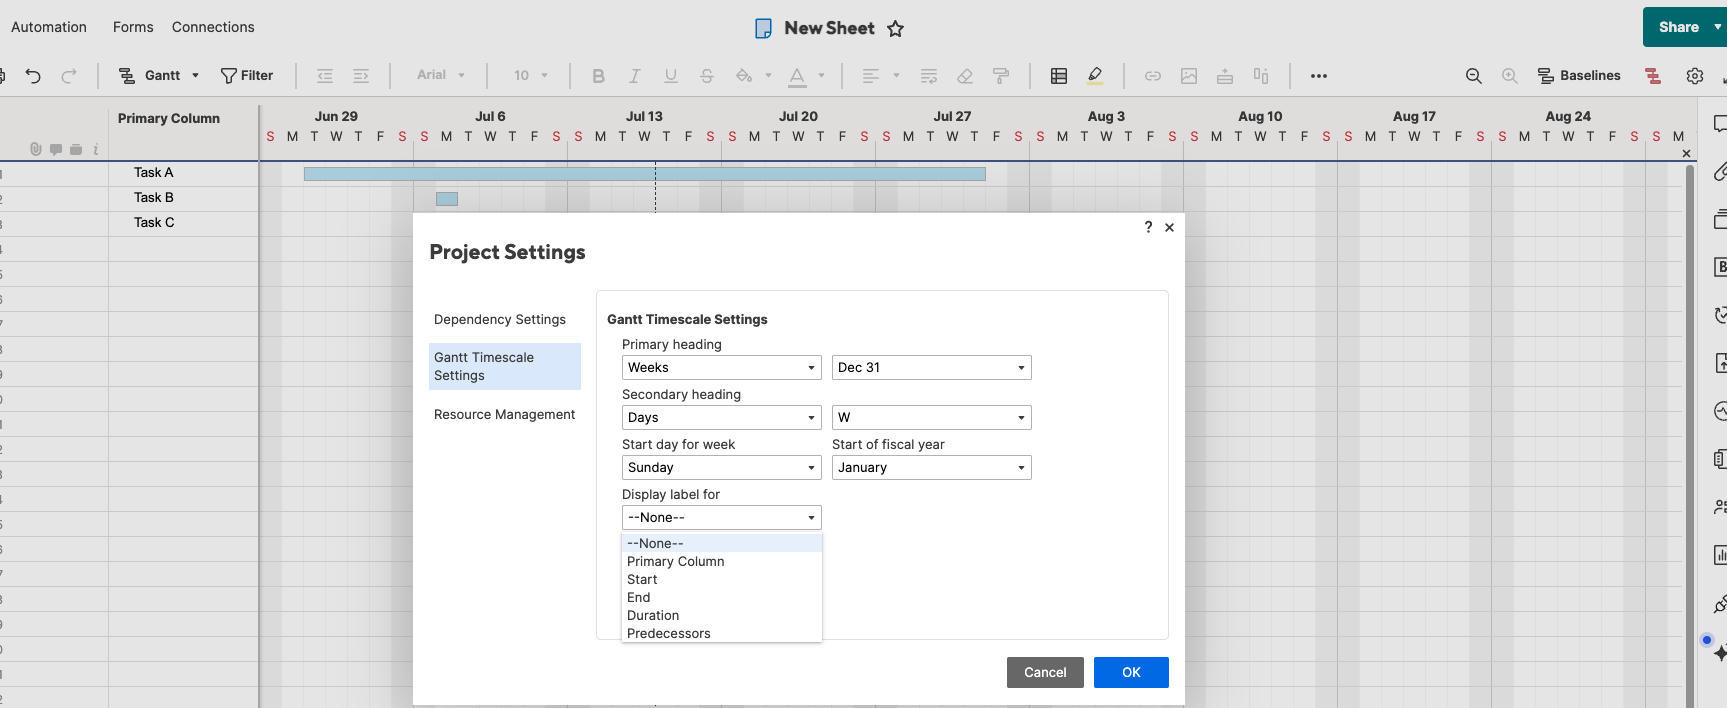
I took the action plan attached my coworker gave me and worked on building a timeline chart. After a lot of research and testing, I learned that Smartsheet doesn’t currently support this kind of detailed Gantt-style visualization with actual dates on the X-axis, mainly due to limitations like too much data and lack of support for date formatting along that axis.
Because of that, I used AI to help create the timeline chart
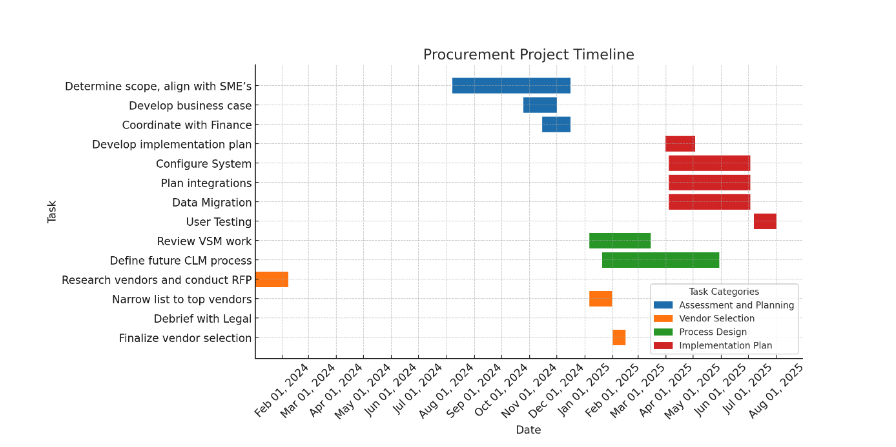
you see above. To keep it clean and readable, I included only the high-level task numbers (1, 2, 3, etc.) and removed the sub-tasks (1a, 1b, 1c, etc.) for now. There was just too much information to show clearly otherwise.
That said, do you know a way to get this kind of timeline working in Smartsheet, I’d really love to learn.
Thanks so much