I have been using the Chart Widgets on a Dashboard for a little over a year now for projects. I make copies of a template workspace I created for every new project. Somewhere along the way, something changed on one of the four chart widgets I use. Below is the best I can summarize:
I have a sheet with a column named Complete that has a check box for each row. This sheet is linked to a report that groups by Complete and Sort Ascending then Summary of Complete and Count. I have this report displayed on a dashboard using a chart report and displaying the information as a donut with the percentage of checked boxes in the complete column. When I update the sheet and check one of the boxes, the report is unlink from the chart report on the dashboard. The color also will randomly default to the Dashboards theme and not what I set it to. There are also differences in one of the chart widgets that I cannot get to mirror the others in the "Data & Chart Type" section. I will post screenshots below.
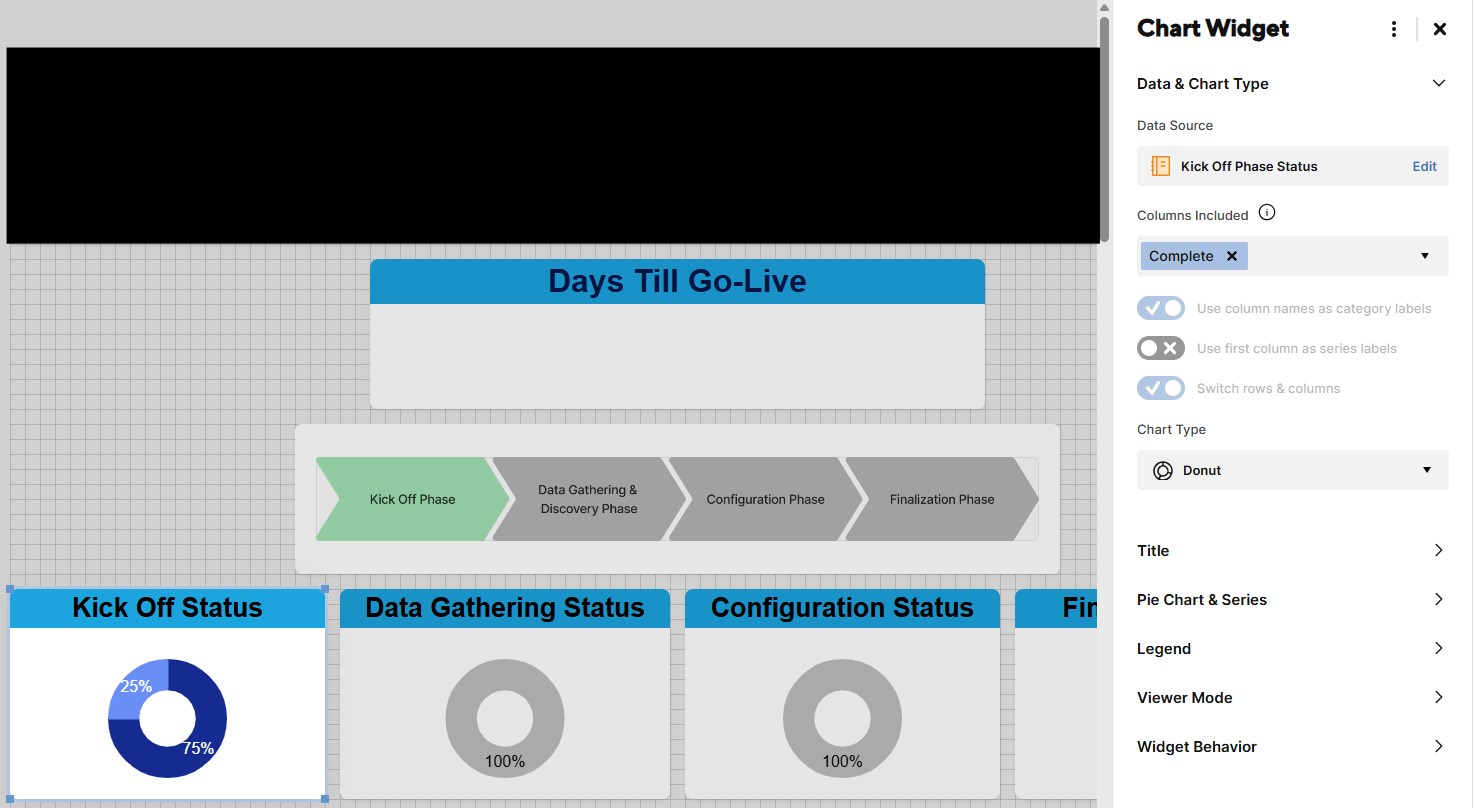
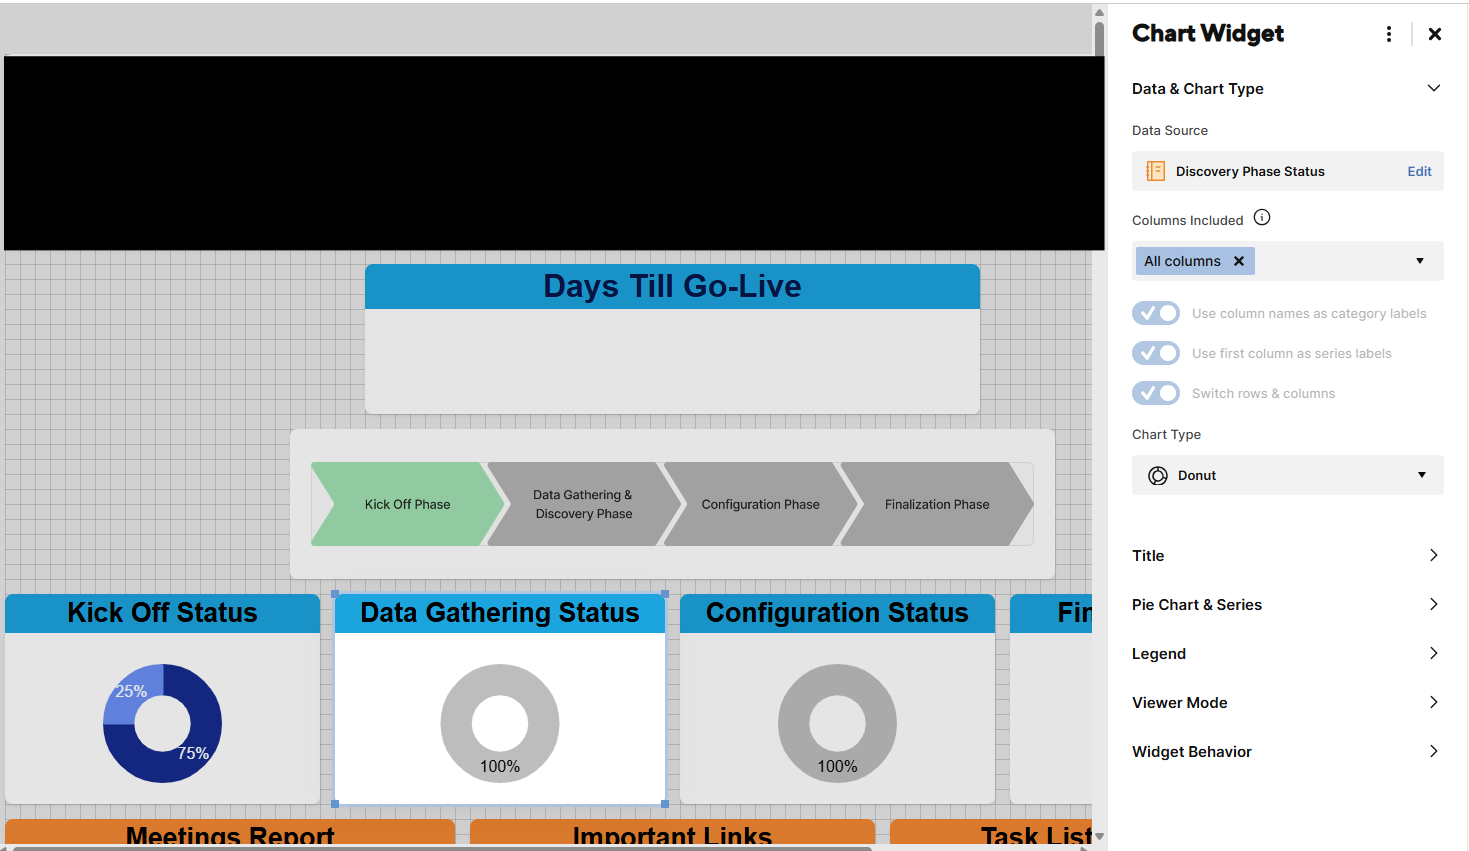
This is really only an issue with the one on the left. I have deleted it and re added it. I have created new sheets and reports and still the issue. If I update the sheet with a checkbox, it often unlinks the report.
I feel like I am kind of rambling but I am having a really hard time describing this as it is several things going on that just to do not make sense to me. It worked just fine for a while and I haven't made any changes to formatting and now its breaking.
Please, any help will be appreciated.

