Hi Community,
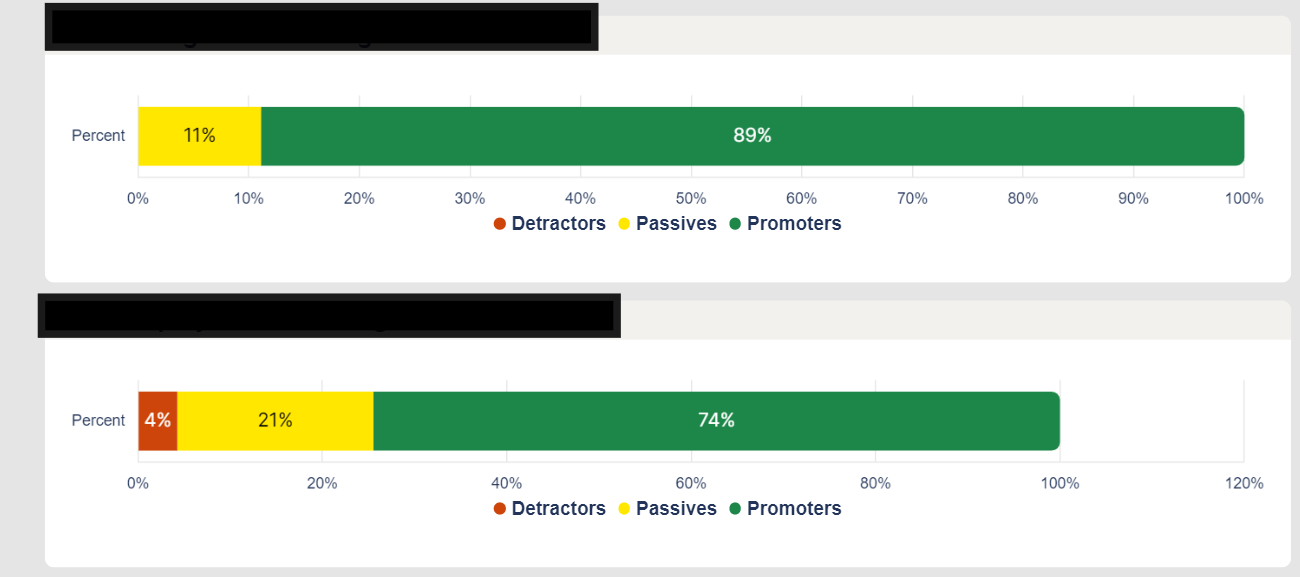
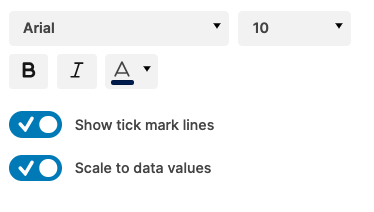
I’m working with 6 stacked bar charts in a dashboard, all displaying percentage data. Five of them correctly cap the X-axis at 100%, but one suddenly started extending to 120% — even though the underlying data still adds up to exactly 100.00.
It was displaying correctly before, just like the others, but one day the dashboard automatically changed and now shows the chart going to 120%. I haven’t modified the settings for this widget or the data structure. I also double-checked the data source to confirm the values total 100%.
Has anyone experienced this or know how to fix it?
Thanks in advance!