Sign in to join the conversation:
Good Afternoon,
We are looking to figure out if it is possible to caculate time in Smart sheets. But we need to be able to figure out times for those items checked vs not checked. Is there a way to do this without sorting the sheet out?
Thanks.
Hi Ann,
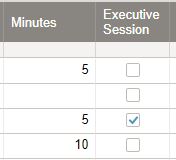
=SUMIF(range, criterion, [sum_range]) will do what you need. Based on your example, this would look like:
=SUMIF([Executive Session]:[Executive Session], 1, Minutes:Minutes). So the result based on the above would be 5.
Chris,
Thank You!Follow up question. So I set that as a new row in my sheet and I made a second row to divide by 60 to figure out how many hours.
I put your formula in for Executive Session Meeting and it gave me the total, 435 minutes.
Then in the next row I put in =SUM(Minutes55) / 60Then this screens shot is the answer I got. How do I turn that into a number of hours?
You are more than welcome.
The reason you're getting an error is that we've previously set a range and sum_range that includes the entire columns. That means your new row will also be included.
Essentially you're creating a loop (circular reference) as the =SUMIF([Executive Session]:[Executive Session], 1, Minutes:Minutes) formula is trying to read the value in Executive Session and Minutes for Row 55, while row 55 is simultaneously trying to calculate a value (from row 54) that actually includes its own value.
It's all very confusing and Smartsheet is throwing out an error.
To get around this, I'd suggest moving your total formulas to the first two rows in another column (call it Totals) or even a new summary sheet. Your hours formula can also be simplified by removing SUM (i.e. =Totals2 / 60), as you're not really summing anything.
Hello, I am trying to create a chart widget in my dashboard, but I keep getting "Selected data cannot be charted. Please select a new range." error. The report I am using is already summarized in numeric value. What is funny is I have report that I created a chart widget in another dashboard, and when I use that same…
I have a picture below for an example of this. I want to create a formula to get counts of items in "Column2", but if "Column4" states "change" I want the "Column2" count to not work and instead count what is it "Column3" in that given row. Column4 can also have several different things in it besides "good" that I want it…
I've done this a million times - create a report, separated by campus with a total $$. Then add it to a dashboard and make a graph. NOTHING is working right now when I try to do this. I get an error that the data cannot be charted. What the what? Help anyone? Is this a issue since they apparently changed something in the…