I've seen some posts about scatterplots, but didn't find comments on the following aspects of scatterplots specifically
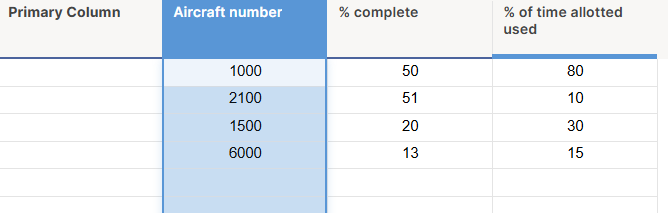
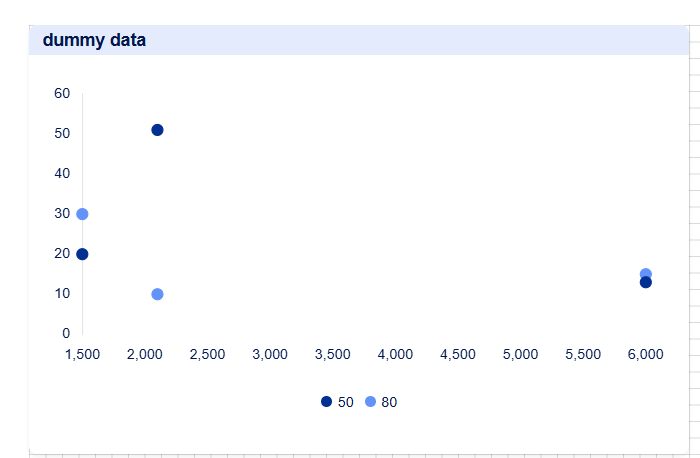
I have numerical data in one column (total score) and a single select in another columns (Level of Effort) that I would like to show on a scatter plot. I've managed to create the scatter plot below, but am stuck on the following items:
1) how do i make labels show up for my dots, tied to another column in my source data? Both as (1) hover over pop ups and (2) on the chart next to the dot. At present i'm just seeing the x and y values when i hover over the dot.
2) My x-axis is showing the same single select value over and over. How do i get it to roll up into one x-axis label per single select value (e.g. 1 - Low, 2 - Medium, 3 - High shown one time each)?
3)How can i have my x-axis labeled 1-Low, 2-Medium, 3-High (left to right), not 3-High, 2-Medium, 1-Low?
Additionally, i don't believe the following things are possible in SmartSheet, please correct me if i'm wrong:
a) having different size dots based on total score, for example.
b) having different color dots, based on a single select value from the data source.