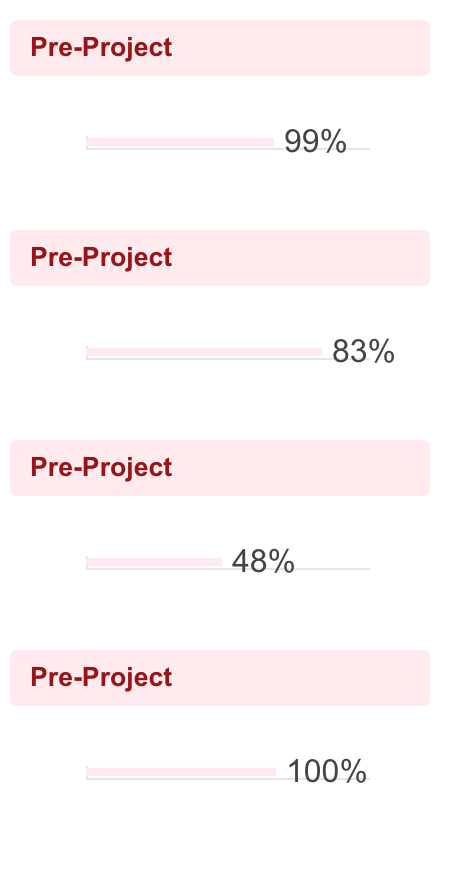
I have created 4 projects and pulled them together on a dashboard. I have created a chart for each section but I have noticed that the lines dont line up. For example on the attached image you will see that the 83% line is further along than the 100%. I have got exactly the same settings on each chart and not using the automatic adjust horizontal but this doesnt seem to look right.
I think this may be related to the fact that when you hover over the bar it say 83%/100% so I think I may have something not setup correctly on the number type.
I am getting the data from a % field in a sheet, that is then populated into a report. Each chart has its own report.
Any ideas???