How to summarize a report?

Pamela Wagner
Pamela Wagner ✭✭✭✭✭✭

I am creating a productivity tracker for my department of 9 people. Each person has a sheet where on a daily basis we note the amount of time we spend on a task and the department we do the task for (we are in IT so we have 15 departments we can work with). I've created metrics on each sheet for the total number of hours spent working for each dept, the % time and then the time bucketed into 4 major categories. From that sheet, I've created a sheet report for each person that will have both of those criteria (total time and % time) against each department then created an actual report for each of our IT departments. Lastly, I then created a master report that pulls in all of the data from each person so I have one report for the full IT dept.

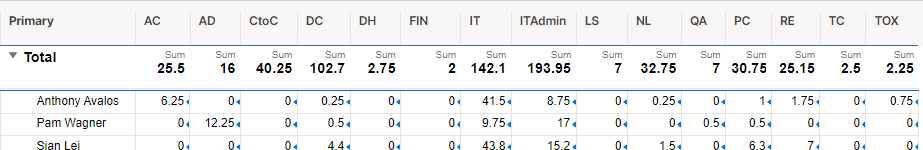
Now I need to graph the total amount of time we spend as an IT department working with each of the departments we support. The first silliness is how do I get my master report to be a sum of all of the data? Right now, I have a row for each of us and columns for each dept:

Of course when I go to my dashboard and try to graph it, it grabs each cell but doesn't sum them. How do I sum the report or how do I create a report that sums each column so I have one total for each department?

Best Answers

  • Andrée Starå
    Andrée Starå ✭✭✭✭✭✭
    Answer ✓

    Hi @Pamela Wagner

    I hope you're well and safe!

    Have you explored using the Grouping/Summary feature?

    Would that work/help?

    I hope that helps!

    Be safe and have a fantastic week!

    Best,

    Andrée Starå | Workflow Consultant / CEO @ WORK BOLD

    Did my post(s) help or answer your question or solve your problem? Please support the Community by marking it Insightful/Vote Up or/and as the accepted answer. It will make it easier for others to find a solution or help to answer!

    SMARTSHEET EXPERT CONSULTANT & PARTNER

    Andrée Starå | Workflow Consultant / CEO @ WORK BOLD

    W: www.workbold.com | E:andree@workbold.com | P: +46 (0) - 72 - 510 99 35

    Feel free to contact me for help with Smartsheet, integrations, general workflow advice, or anything else.

  • Genevieve P.
    Genevieve P. Employee Admin
    Answer ✓

    Hi @Pamela Wagner

    Thank you for this updated screen capture! I can see that you only have a Summary applied, so there are no Grouped rows within this Report.


    The top "Total" row isn't currently supported with this new release, whether or not there are Groupings below it: Charts can only grab from the first level Groupings underneath that top Total.


    What is the Filter for this Report, or how are you defining the rows that you're bringing in? If there are no columns in this current Report that have consistent or identical data, then I would suggest adding a helper column to the source sheet(s) so you can use the Group feature... something that will be consistent across all your rows. In my example I've used a Star:

    Even though it's the exact same Data, this allows me to use the Group feature to group the entire Report and gather the Sum at the top. Now I can create a Chart from the one Grouped row, below the Total.

    Let me know if this makes more sense! Please also provide your feedback on the new feature release by filling in this form, here.

    Cheers,

    Genevieve

Answers