Connect with peers, share your expertise, and inspire what’s next in Smartsheet — from proven practices to practical how-to insights from fellow users and product experts.
Sign in to see the current vote count, add your own vote, or leave a comment.
I really miss allowing the user to actively filter information from their dashboard view. I wish I could have a filter button that could be positioned on the dashboard. Then the user could choose to see the data of a period or a project, for example.
Hi @Naeem Ejaz and @Julie Becker
Thank you for making me notice the Dynamic Dashboard template! It’s a great reference, and I appreciate your insights.
After reviewing the template, I found that its logic is essentially identical to the approach I shared earlier (see my post dated January 17, 2024). Even the “Max Row Helper” column name and structure are the same, which leads me to think that Smartsheet may have drawn on this idea.
Also, special thanks to @Andrée Starå for suggesting the idea of sharing a published sheet link. I’ve adopted a slightly different approach: instead of automatically loading the dashboard after form submission, I send users to the sheet where the form input lands. This triggers the report’s filter change, and a single dashboard refresh updates all the results much faster.
With this modification, I no longer need to manually refresh the dashboard twice—just one refresh shows the updated filtered data.
https://app.smartsheet.com/b/publish?EQBCT=6afd3106beb344c498d01940a69cf017&_gl=1whaa3v_gcl_auMTkwODM5MDE5Ny4xNzUzNzQ0MjEx_gaMTQxMzE3OTczOC4xNzIzMTc2MDk0_ga_ZYH7XNXMZK*czE3NTM3NzE5OTckbzE3JGcxJHQxNzUzNzc0MTYyJGozNSRsMCRoMA..
Thanks again for sharing and inspiring improvements on this method!
@jmyzk_cloudsmart_jp
You’re most welcome! 😊 It’s truly my pleasure to help — that’s what the Smartsheet Community is all about: supporting each other and sharing solutions so we can all get the most out of the platform. I’m glad the Dynamic Dashboard template was useful for you, and I’m always happy to exchange insights whenever needed.
You're more than welcome!
1️⃣ Why do you prefer your method to going to the sheet instead of mine, which refreshes the Dashboard? Have you had any issues?
2️⃣ When I have multiple values I want to filter on, I add them all to the form instead of having to use two selectors. Is there a reason why you've split them out?
Thanks!
We would like our Leadership team to be able to apply a filter and see the stats for a specific department on our dashboard. Right now, we have to make a separate dashboard for each department and then put them as Quick Links on the dash which gives us a lot more to maintain and is less nimble.
@Laurenzella - Refer towards the End of Page 5 🌐 click here of this subject as a few of us ( @Naeem Ejaz & I tested a template providing feedback and @jmyzk_cloudsmart_jp provided temp. fixes/solutions that might help you as you scroll down page 5. A special thanks to @Andrée Starå suggesting a quick fix/solution on addressing the need to manually refresh the dashboards each time the end user wants to change the filtered data.
Hi @Andrée Starå
Keen questions!
I chose to send the form sheet as I do not want to clutter with multiple dashboards. But your method is also practical when you do not expect numerous filter changes.
Additionally, when dealing with data that has multiple filters, such as projects categorized by region, department, type, etc., and you wish to narrow down the data using form filters within a dashboard, it's advisable to avoid cluttering numerous dashboards.
As for the second question, this specific base sheet happens to have a one-to-one relationship between project and region. A project is only one of the North, West, East, and South. So, selecting both in a form is not necessary. The second filter has a different purpose. The filter aims to display the project's data and the chart for the selected area. And, for the drill-down case, having separate filters is better.
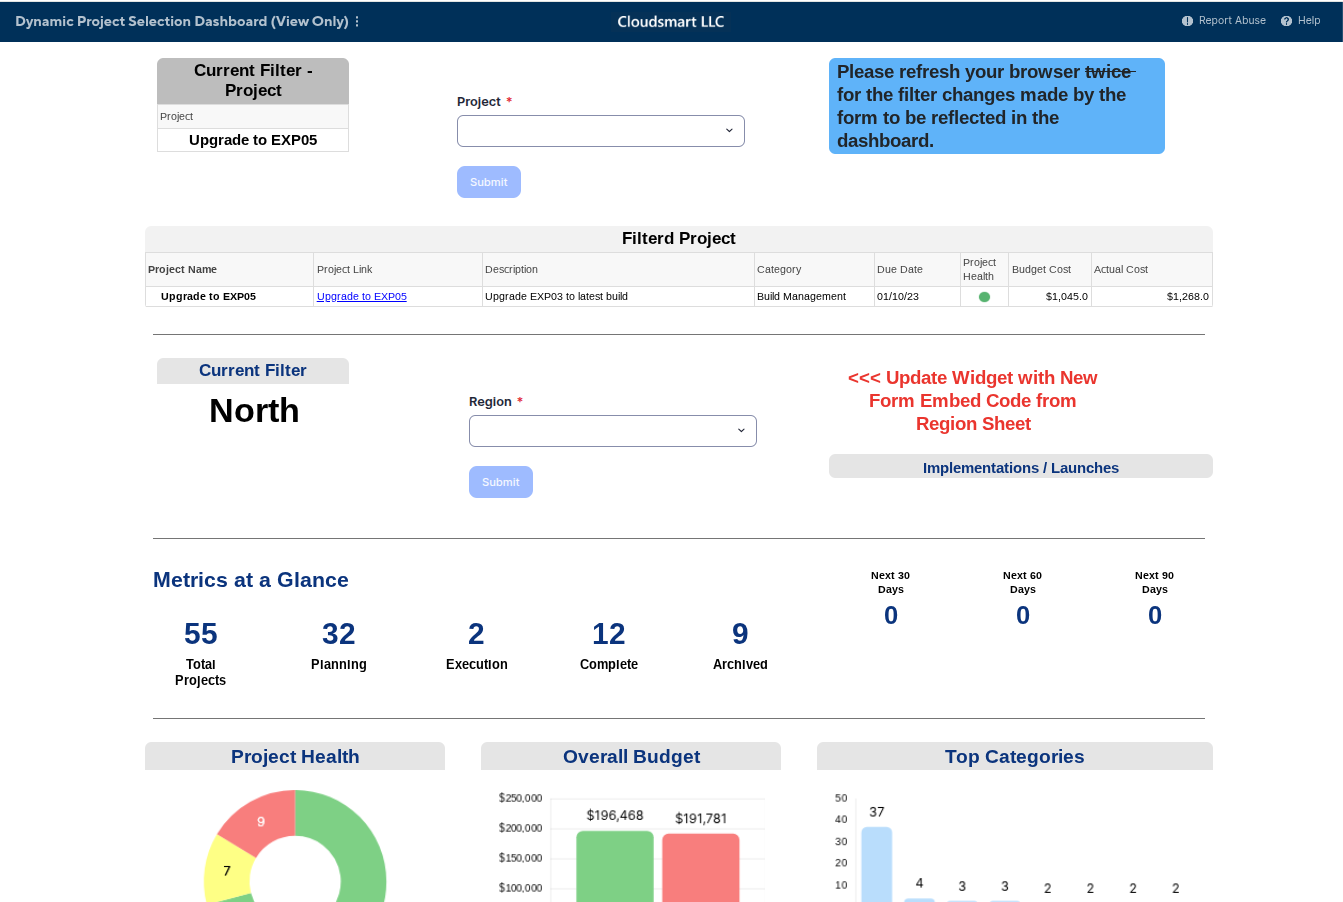
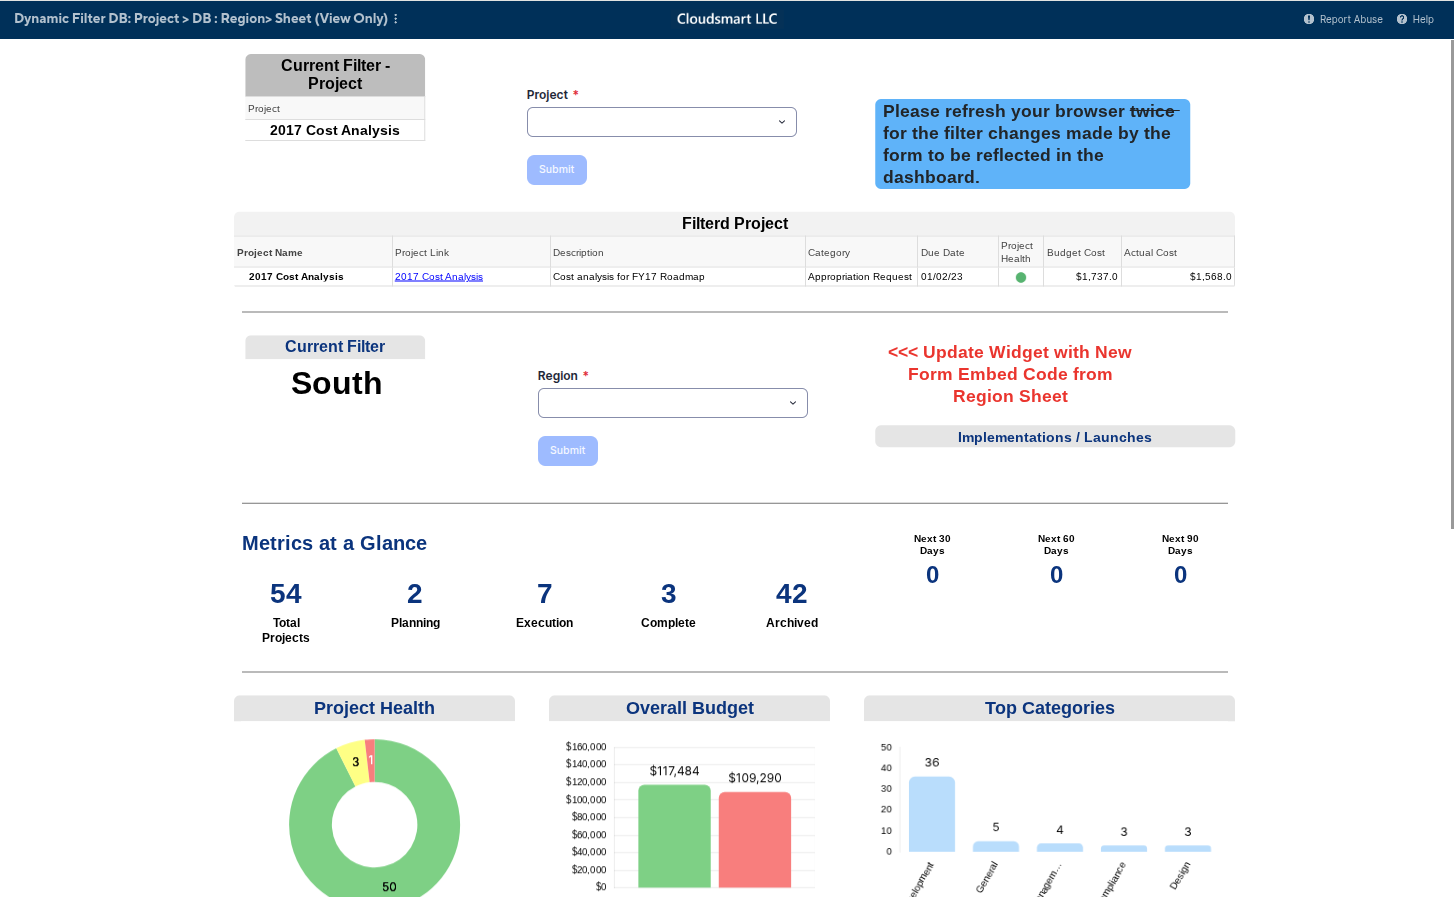
In the demo dashboard below, the project form filter uses your method, whereas the region uses my method.
In the case of the project filter, if you select one and show the result, it's done.
However, in the region filter case, you may want to see various regions one by one. In that case, not having multiple dashboards may have some advantages. Still, your method may be good to change the tab to compare multiple dashboards.
https://app.smartsheet.com/b/publish?EQBCT=cb6050b23f084131951b345936489109
This would be amazing. It is the reason some of our leadership stayed in Tableau or Power BI instead of moving to Smartsheet. We use dynamic filters in research to define the study and align the study metrics such as enrollment, where is the study start up process we are, if we are working on an amendment, etc. For Investigators, we like to align the metrics of how many open studies do they have, how many patients have they enrolled, how many patients are across all their projects, etc.
This will be a great reporting tool to really make other reporting tools like Tableau and Power BI take a look at their offerings. I have stayed in Smartsheet as the filters, formulas, and options to create exactly what I need for my dashboards is much more user friendly than the others.
This would be a huge improvement for our dashboards. We have multiple medical groups and need to be able to show many different views of our quality metrics for our company overall that include those medical groups for our execs, but then separately be able to only show results for a specific medical group as they can't see the results from other medical groups. Along with this, we would likely need to be able to set the dashboard globally so we can jump between sub-dashboards for the different kinds of metrics without having to reset that filter each time. I'd be happy to talk through this and show an example if needed.
Dear [Team/Smartsheet Support],
Currently, the Smartsheet Dashboard only displays data based on pre-set configurations. However, during daily management and monitoring, it is essential to have the ability to filter or select information directly on the Dashboard.
For example, users should be able to select a specific month, quarter, or category and have the Dashboard automatically update the related charts, reports, and metrics. This feature would:
I kindly request that you consider adding the filter/selection function directly on the Dashboard to improve usability and efficiency.
Thank you for your support.
Best regards, Ta Van Truong
Dear Smartsheet Support, I would like to request a new feature that allows users to filter data directly on the Dashboard (e.g., by month, quarter, or category). This will make data monitoring more flexible and reduce the need for manual report filtering.Best regards,
Thanks for the suggestion, @Andrée Starå!
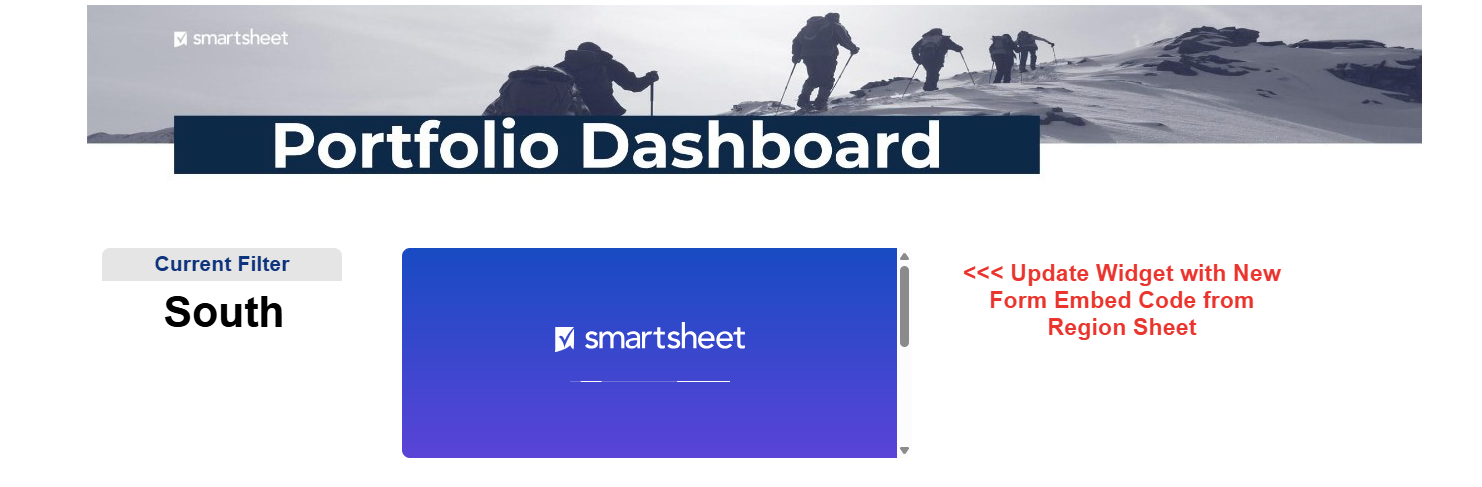
I tried to incorporate your client solution into Smartsheet's template, however after form submission, only the embedded form in the dashboard is refreshed rather than the entire dashboard. I've shared a screenshot below where the loading screen appears after form submission. Wanted to ask if I am missing something here, or is this is a limitation Smartsheet?
Thank you in advance!
@Deb Peters and @212629278
We do have a low cost add on called Smarter Dashboards which does all the things you've mentioned and more. Free 2 week trial available, you can use it on a monthly subscription until Smartsheet deliver on their Engage Message and provide filterable dashboards themselves.
Feel free to reach out if you'd like a chat about if this tool would work for you.
Kind regards
Debbie
I want to provide some learnings that I have that may be helpful to some. I also implemented the 'Dynamic Dashboard' template for one of my dashboards, as I needed to change the filter settings for about 16 reports included in the Dashboard based on user input. The dynamic filter worked GREAT for this!
There was one very big issue, however. There is only ONE filter that can be active at any given time for the same dashboard. If you have multiple users using the dashboard at the same time, they will potentially overwrite each other's filters. The more users, the higher the probability of this happening.
Obviously, this is only an issue if the first user refreshes the dashboard after another user has changed the filter. But, in my opinion, this was enough of a confusing UX issue for me to abandon this method of filtering except for dashboards with very small audiences.
Hope this helps,
Tony
Dear all in this thread,
We have had a Smarter Dashboards app available for a good couple of years. It provides all the features that you are all asking for!
There is a free trial, a monthly purchase option and now, a fab AI front end that will create your dashboard in minutes! New URL (as we've updated our assets). https://smarterdashboards.net/
Please try it out and see if it will give you what you need until Smartsheet provide the same functionality within the core license.
Sign in to comment or add your vote.