Connect with peers, share your expertise, and inspire what’s next in Smartsheet — from proven practices to practical how-to insights from fellow users and product experts.
Sign in to join the conversation:
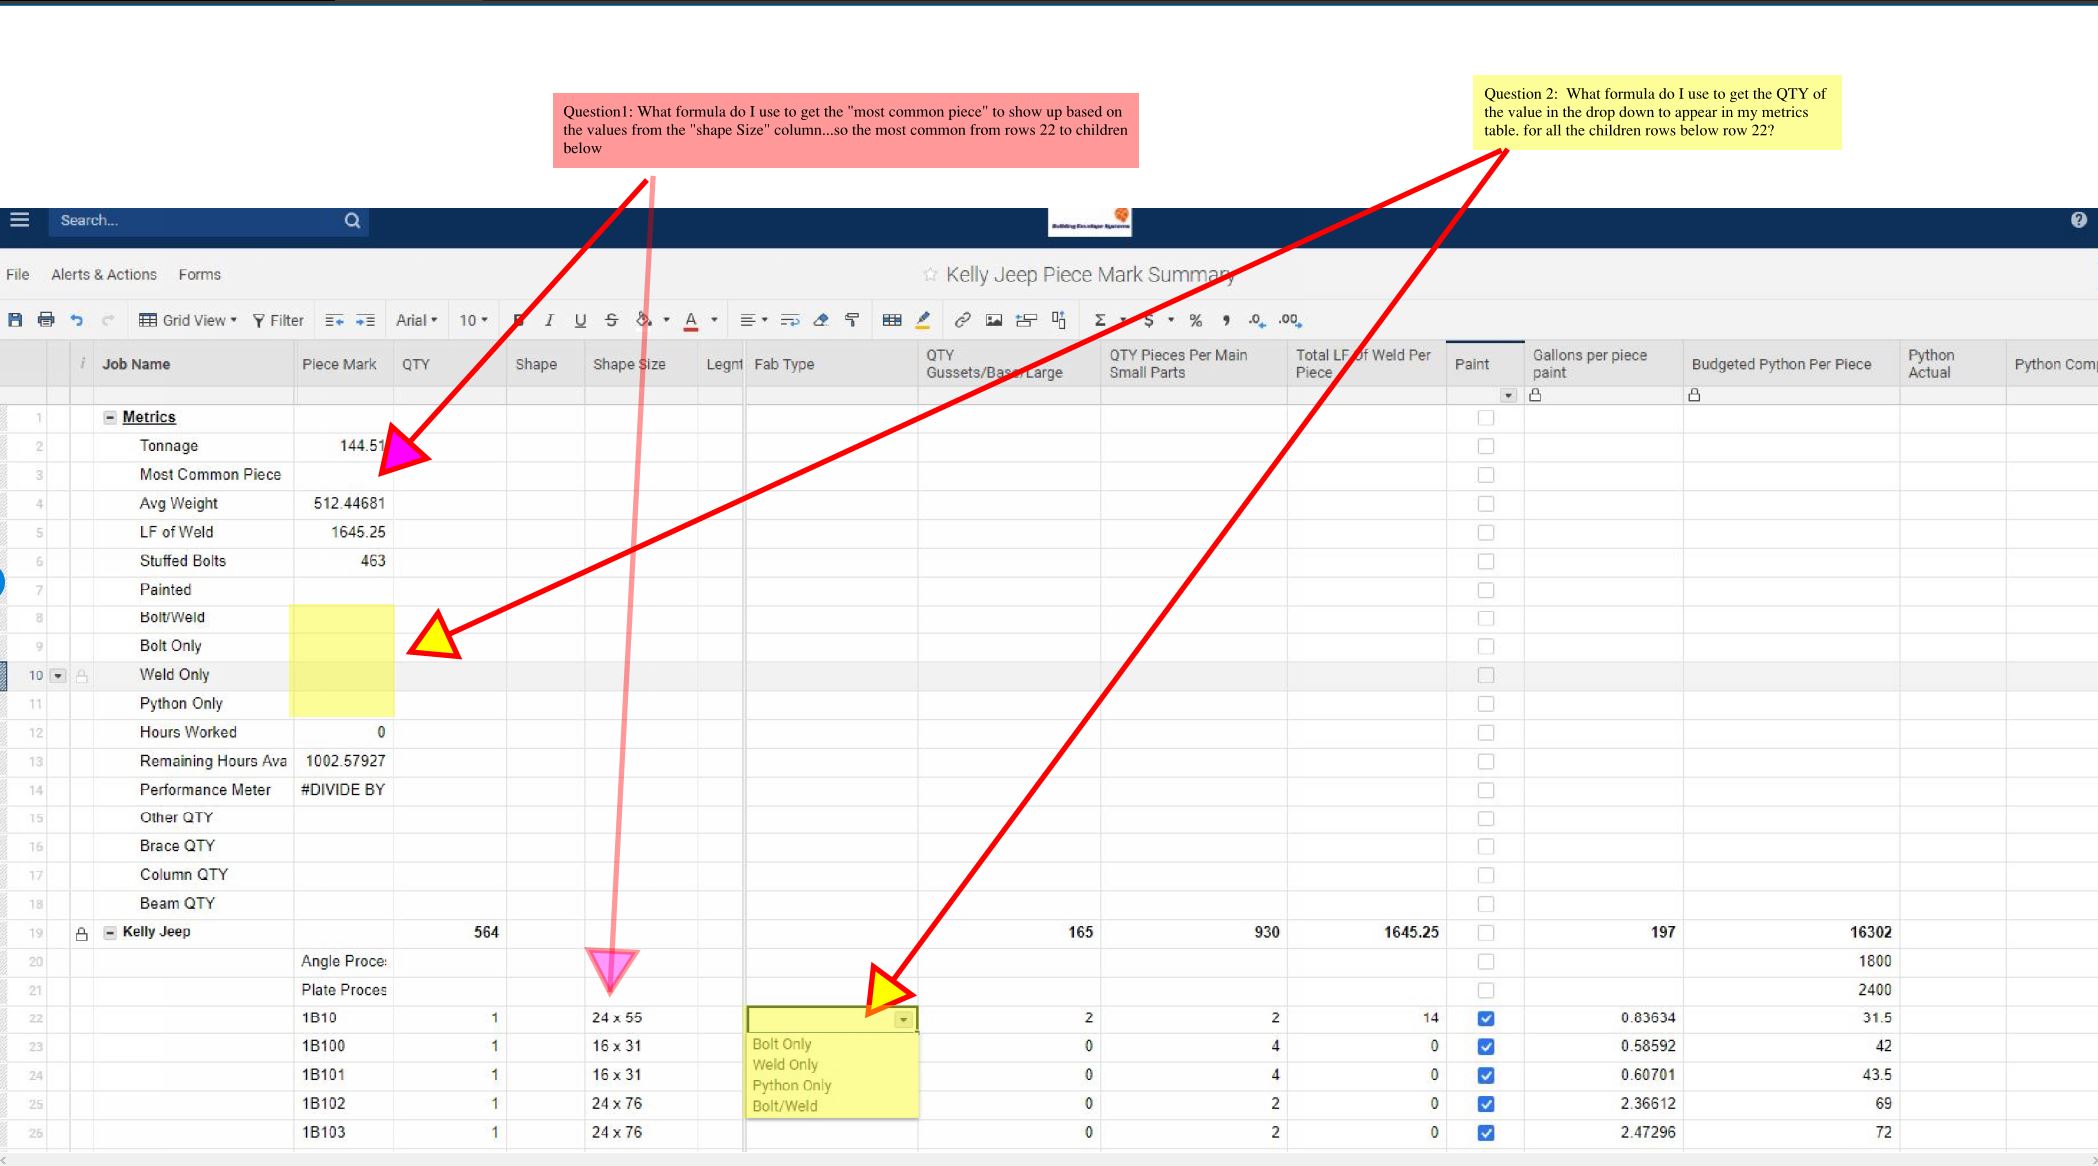
Good afternoon, Looking for some help on setting up formulas to capture the following metrics per attached. Any help would be greatly appreciated.
Thank you !
Not too sure about your Red question, but for the yellow question you could use the following formula:
=countifs([Fab Type]:[Fab Type], =[Job Name]@row
This will count all of the occasions of your job name in the Fab Type column.
For more on countifs:
https://help.smartsheet.com/function/countifs
OK thank you
There must me some formula that will give me the most common value entered in a column....... I will keep searching
Hello,
Based on the description of the questions provided you may be able to achieve these desired goals by combining some Smartsheet Functions. I've answered your questions in the order provided below.
1. To get the "most common piece" to show up based on the value from the "Shape Size" column you may be able to achieve this utilizing a IF function combined with a COUNTIF. The COUNTIF would find the exact count of each type and the IF will compare them against each other.
IF Function: https://help.smartsheet.com/function/if
COUNTIF: https://help.smartsheet.com/function/countif
The formula could look like this, note I haven't added all the potential values, only two of them.
=IF(COUNTIF([Shape Size]22:[Shape Size]26, "24x55") > COUNTIF([Shape Size]22:[Shape Size]26, "16x31"), "24x55", IF(COUNTIF([Shape Size]22:[Shape Size]26, "24x55") < COUNTIF([Shape Size]22:[Shape Size]26, "16x31"), "16x31"))
Note: You'll want to add all of the potential values to the end of the formula. You can achieve this by removing the )), replace them with a comma, then add the rest of the formula values.
2. To get the QTY of the value in the dropdown to appear in relation to the values displayed in the metrics table you can achieve this utilizing a VLOOKUP.
VLOOKUP: https://help.smartsheet.com/function/vlookup
The VLOOKUP can reference the value desired in the metrics table such as "Bolt Only" row 9 and display any desired value at the bottom table of row 22 such as 2 in the column small parts.
The formula could look like this.
=VLOOKUP([Job Name]@row, [Fab Type]22:[Total LF of Weld Per Piece]26, 3,false)
Have a wonderful day,
Eric - Smartsheet Technical Support
In my mind's eye, I was imagining creating a separate sheet to count all the various parts on the order forms and then using a combination of Vlookup and MAX formulas to pull the most ordered part. But I don't have time to think that one through thoroughly.
Thank you
I may have to wait until I get more knowledgeable for the question in red.
I can t seem to get it to work, thank you though!
I have an end date column and want to add 30 days to that for a new column that shows due date. How do I add 30 days to a date automatically?
The dashboard previously contained 16 widgets, and I have confirmed that the widgets still exist in the backend. However, when I open the dashboard, nothing is displayed, and I am unable to enter Edit Mode or access the widgets/data sources. I have already confirmed the following: I am the owner of the dashboard and have…
Why is it so convoluted now! I eventually figured out the changes and ended up with a sheet that Smartsheet completely reorganised the rows and the sheet is now useless to me as it is not in a logical order for me to easily restore to its original layout. This is not an "improvement"! It was far easier to upload data…