Connect with peers, share your expertise, and inspire what’s next in Smartsheet — from proven practices to practical how-to insights from fellow users and product experts.
Sign in to join the conversation:
I have a dashboard chart widget that was pulling data from a single select option. I've now changed it to multi-select but I see that my chart isn't pulling in that item at all when there are more than 1 item selected. Am I missing something? Is there a formula that I can use to pull in that single option + any combination that could be selected as part of the multi-select function?
Are you able to provide a screenshot of your sheet and how you want the data displayed on a dashboard? Sensitive/Confidential data can be blocked, removed, or replaced with "dummy data" if needed.
Basically, it's not showing up on my dashboard widget. It's essentially not pulling in the number from that item because it has multiple items in that one cell, it's not counting that cell since it's not an exact match. It's kind of hard to explain and I don't think a screenshot will help since I'm pulling the data from one sheet into another data sheet for my dashboard widget.
If you can share a screenshot of both of the sheets (data and metric sheets), we can help with a formula that accounts for a multi-select column. There are a lot of different ways to go with it though, so having the screenshots would really help.
If you are looking for an exact match on a combination, you would use something similar to as if it were a single-select, but if you are looking for any cell that contains that particular choice even if other choices were made with it, you would use a CONTAINS function.
A lot of it depends on your setup and use case.
Hi Samira,
I agree with Paul, Screenshots would help immensely.
Can you describe your process in more detail and maybe share the sheet(s) or some screenshots? (Delete/replace any confidential/sensitive information before sharing) That would make it easier to help. (share too, andree@getdone.se)
I hope that helps!
Have a fantastic weekend!
Best,
Andrée Starå
Workflow Consultant / CEO @ WORK BOLD
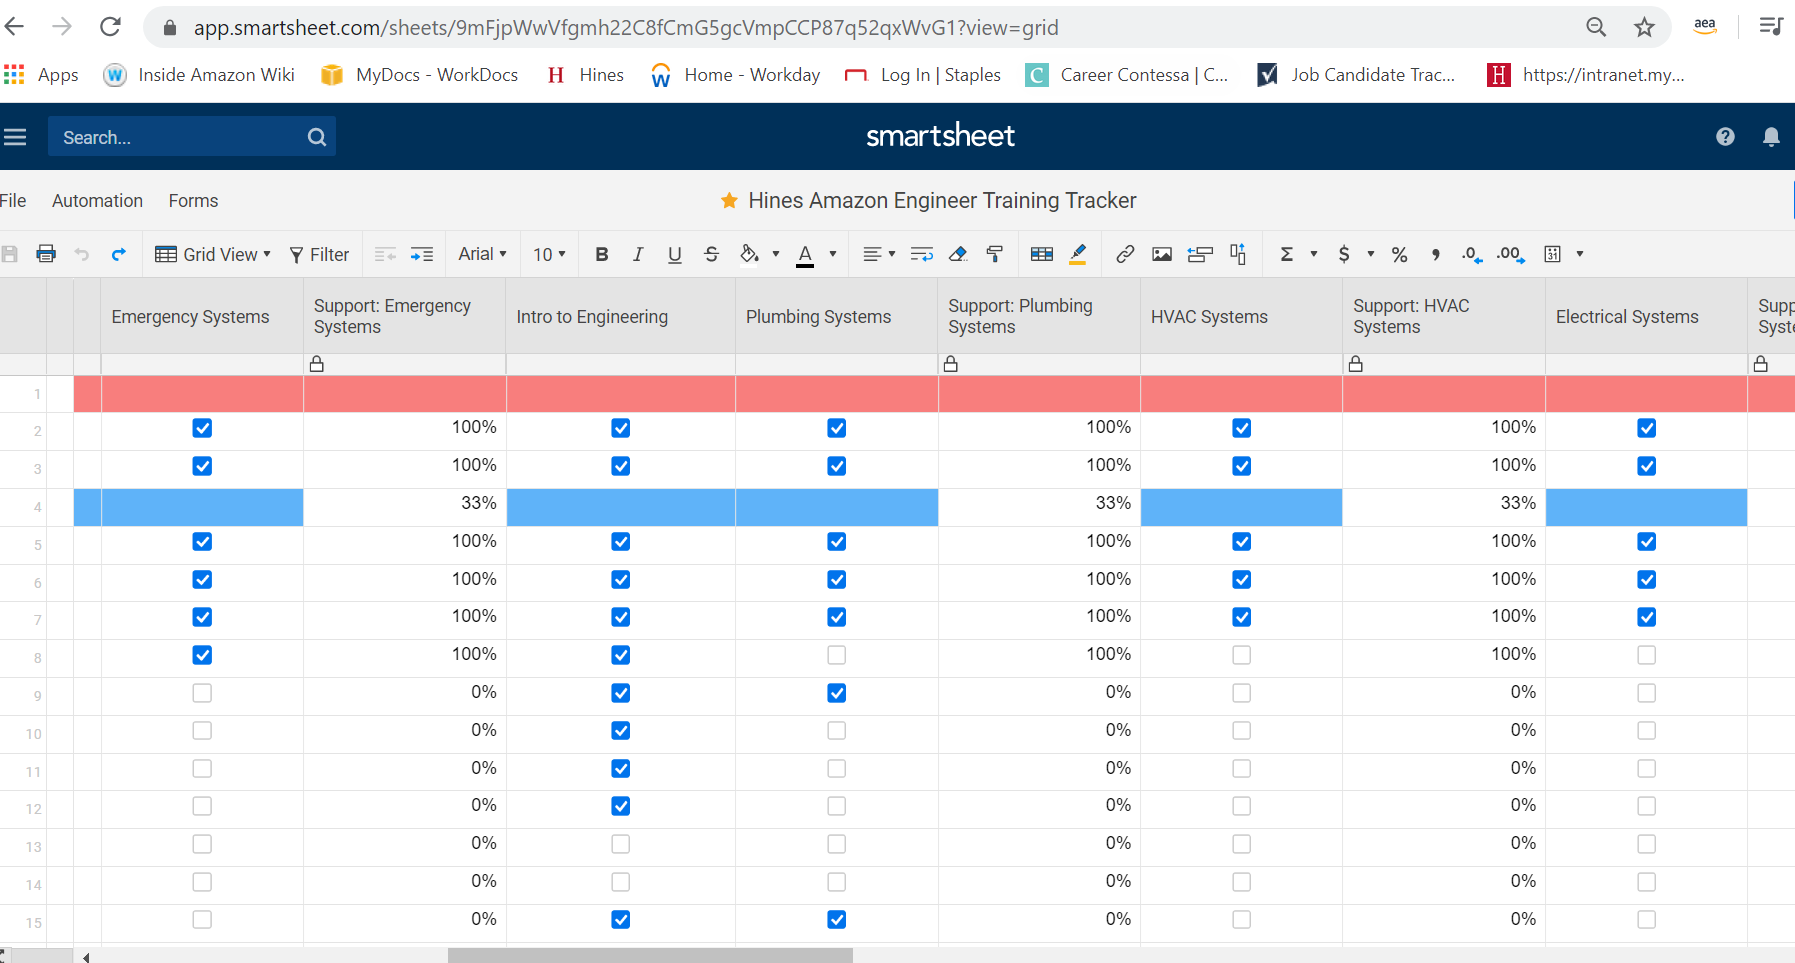
I am having the same problem, I need to add the ones with 'support' all of them in order to create a graph:
Hi @Becky Hawk
Would you mind explaining a bit further? Are you wanting a total % added together for each row across the Support columns? Or are you wanting to show each Support % in a chart?
You can create Charts off of Reports, so one way to consolidate this data may be to create a Report that only shows rows where the three Support Columns contain data greater than 0. You can then create a Chart Widget from that specific Report.
If you wanted the Chart to display Summed information, you would first need to have that data somewhere on your sheet for the chart to read it, perhaps in a new Helper column that uses a formula to SUM the information in those columns for that row. Let me know if you need help creating that formula.
Cheers!
Genevieve
@Genevieve P I always forget that you can build a chart off of a report. This may end up changing a few things for me... Thanks for the reminder!!
No problem, @Paul Newcome !
The main thing to keep in mind is that it will select the entire data of the Report (you can't select sections)... so make sure your criteria in the Report Builder filter down your data to exactly what you want to see in the chart.
I also find that sometimes I have to choose the report, click on something else, then choose the report again for it to properly recognize where the data starts/ends. 🤷
@Genevieve P I am definitely going to have to play around with it. I already have a few ideas of where it may make my life easier even with having to make sure my data is exactly what I want for the chart.
The dashboard previously contained 16 widgets, and I have confirmed that the widgets still exist in the backend. However, when I open the dashboard, nothing is displayed, and I am unable to enter Edit Mode or access the widgets/data sources. I have already confirmed the following: I am the owner of the dashboard and have…
I have an end date column and want to add 30 days to that for a new column that shows due date. How do I add 30 days to a date automatically?
Why is it so convoluted now! I eventually figured out the changes and ended up with a sheet that Smartsheet completely reorganised the rows and the sheet is now useless to me as it is not in a logical order for me to easily restore to its original layout. This is not an "improvement"! It was far easier to upload data…