Connect with peers, share your expertise, and inspire what’s next in Smartsheet — from proven practices to practical how-to insights from fellow users and product experts.
Sign in to join the conversation:
Greetings
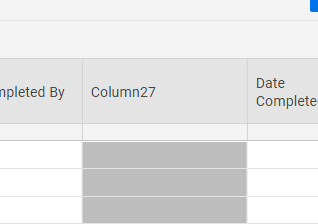
I some how got the background of one of my smartsheets to appear gray whenever I create a new column and when I pull a report and display the Sheet Name (system column) it too appears to be gray. I have doubled checked the conditional formatting and I am not using any gray colors. I have all my other columns white now but when I create a new column or look at the sheet name in reports it appears to be gray.
Thanks
Hi @Ty Layton
Check if you have hidden columns and select them all and use the Clear Formats feature.
Did that fix it?
I hope that helps!
Be safe and have a fantastic weekend!
Best,
Andrée Starå
Workflow Consultant / CEO @ WORK BOLD
✅Did my post(s) help or answer your question or solve your problem? Please help the Community by marking it as the accepted answer/helpful. It will make it easier for others to find a solution or help to answer!
Greetings Andrée
I have have done this and it did not fix my issue. New colunms still show up as gray. (see below) and Sheet Name still show gray in my reports.
Check your conditional formatting rules. There may be something in there that's causing the issue.
Hope that helps.
Greetings Ramzi,
I have double checked my conditional Formatting and I dont see an issue there. I am using red and orange formatting. No grays, I also disabled the 4 conditional formatting and the issue is still present.
I am currently setting up an automation for people to get notified through their email, when they are prompted. But is there a way that they can reply in the email of a comment that will then go to the specific sheet. This way they do not have access to the sheet, but can just comment through email with updates?
Is there a way to revert to the old dashboard look and feel. The new dashboards do not look good at all. There is no way of knowing if there are additional items in the widgets until you scroll over one to learn there is more to it since the vertical bar doesn't show. We have hundreds of dashboards and they will all need…
When i try to send or print the timeline view instead of showing the progression bars like they do on the screen it only send the data entered and not a graph type view to print. Is there a way to do this. I am using a mac platform if that helps.