Y'all... I struggle with formulas. Please help!
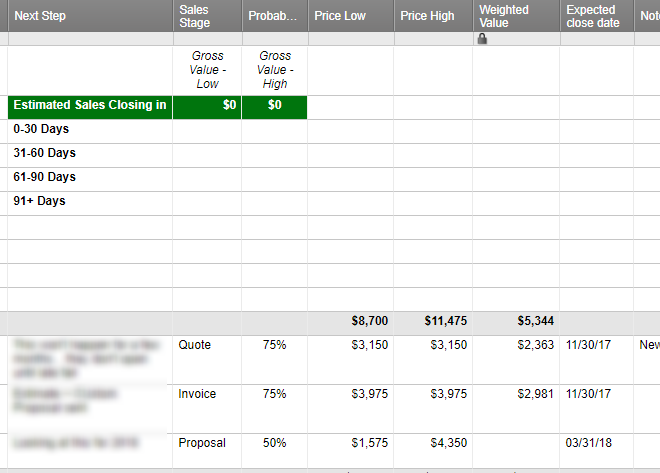
On our sales tracking sheet, we track probability of the sale closing, expected close date, and the price low and price high of each potential sale. I'm currently using a modified version of the Sales Pipelne with Summary template.
In addition to the summary (that shows potential sales at every stage of the sales process), I want to create a chart at the top of each page that tracks the total amount of potential sales (the low price and the high price) that have a 51% or higher chance of closing. I want to show sales at that level of probability that are with 30 days of the expected close date. Then 31-60 days. Then 61-90 days.
We also track CLOSED/WON sales (at 100%) on this page, so if it is marked at 100%, I do not want to include it in the totals.
Basically, I need the right formula to capture this:
In the "Gross Value Low" column, on the first line (0-30 days), I need the SUM of all PRICE LOW of all entries if PROBABILITY is >50% but <100% AND the expected close date is 0-30 days away. Then I'd need the sum of the PRICE HIGH for those same conditions.
On the second line, in the "Gross Value Low" column, I'd need: the SUM of all PRICE LOW of all entries if PROBABILITY is >50% but <100% AND the expected close date is 31-60 days away.
And so on.
Can anyone help?