I am create a pivot table using pivot app, and it takes the 2 columns I am using and places them as a parent child in one column which is fine, but when I try to chart the results there is no way to separate or filter the chart to show either the parent or the child data independent of one another. Is it possible to use helper columns to break out the parent/child data for charting or will the updating of the pivot chart negate the helper columns results?
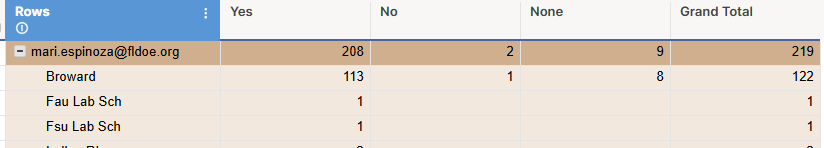
I want to show the parent as one graph and the child data as a different graph.
Do filters or expand/collapse functions on the pivot table affect the graphs displayed?

