Ability to add analyze data charts to dashboards now generally available!

June 30, 2025
You can now add dynamic charts generated by the analyze data AI tool to new or existing dashboards with data that updates in real time as your projects progress, giving you up-to-date insights into your data without needing to manually build a chart. Quickly visualize your data and easily build dashboards to share insights into your projects, just by typing what you need.
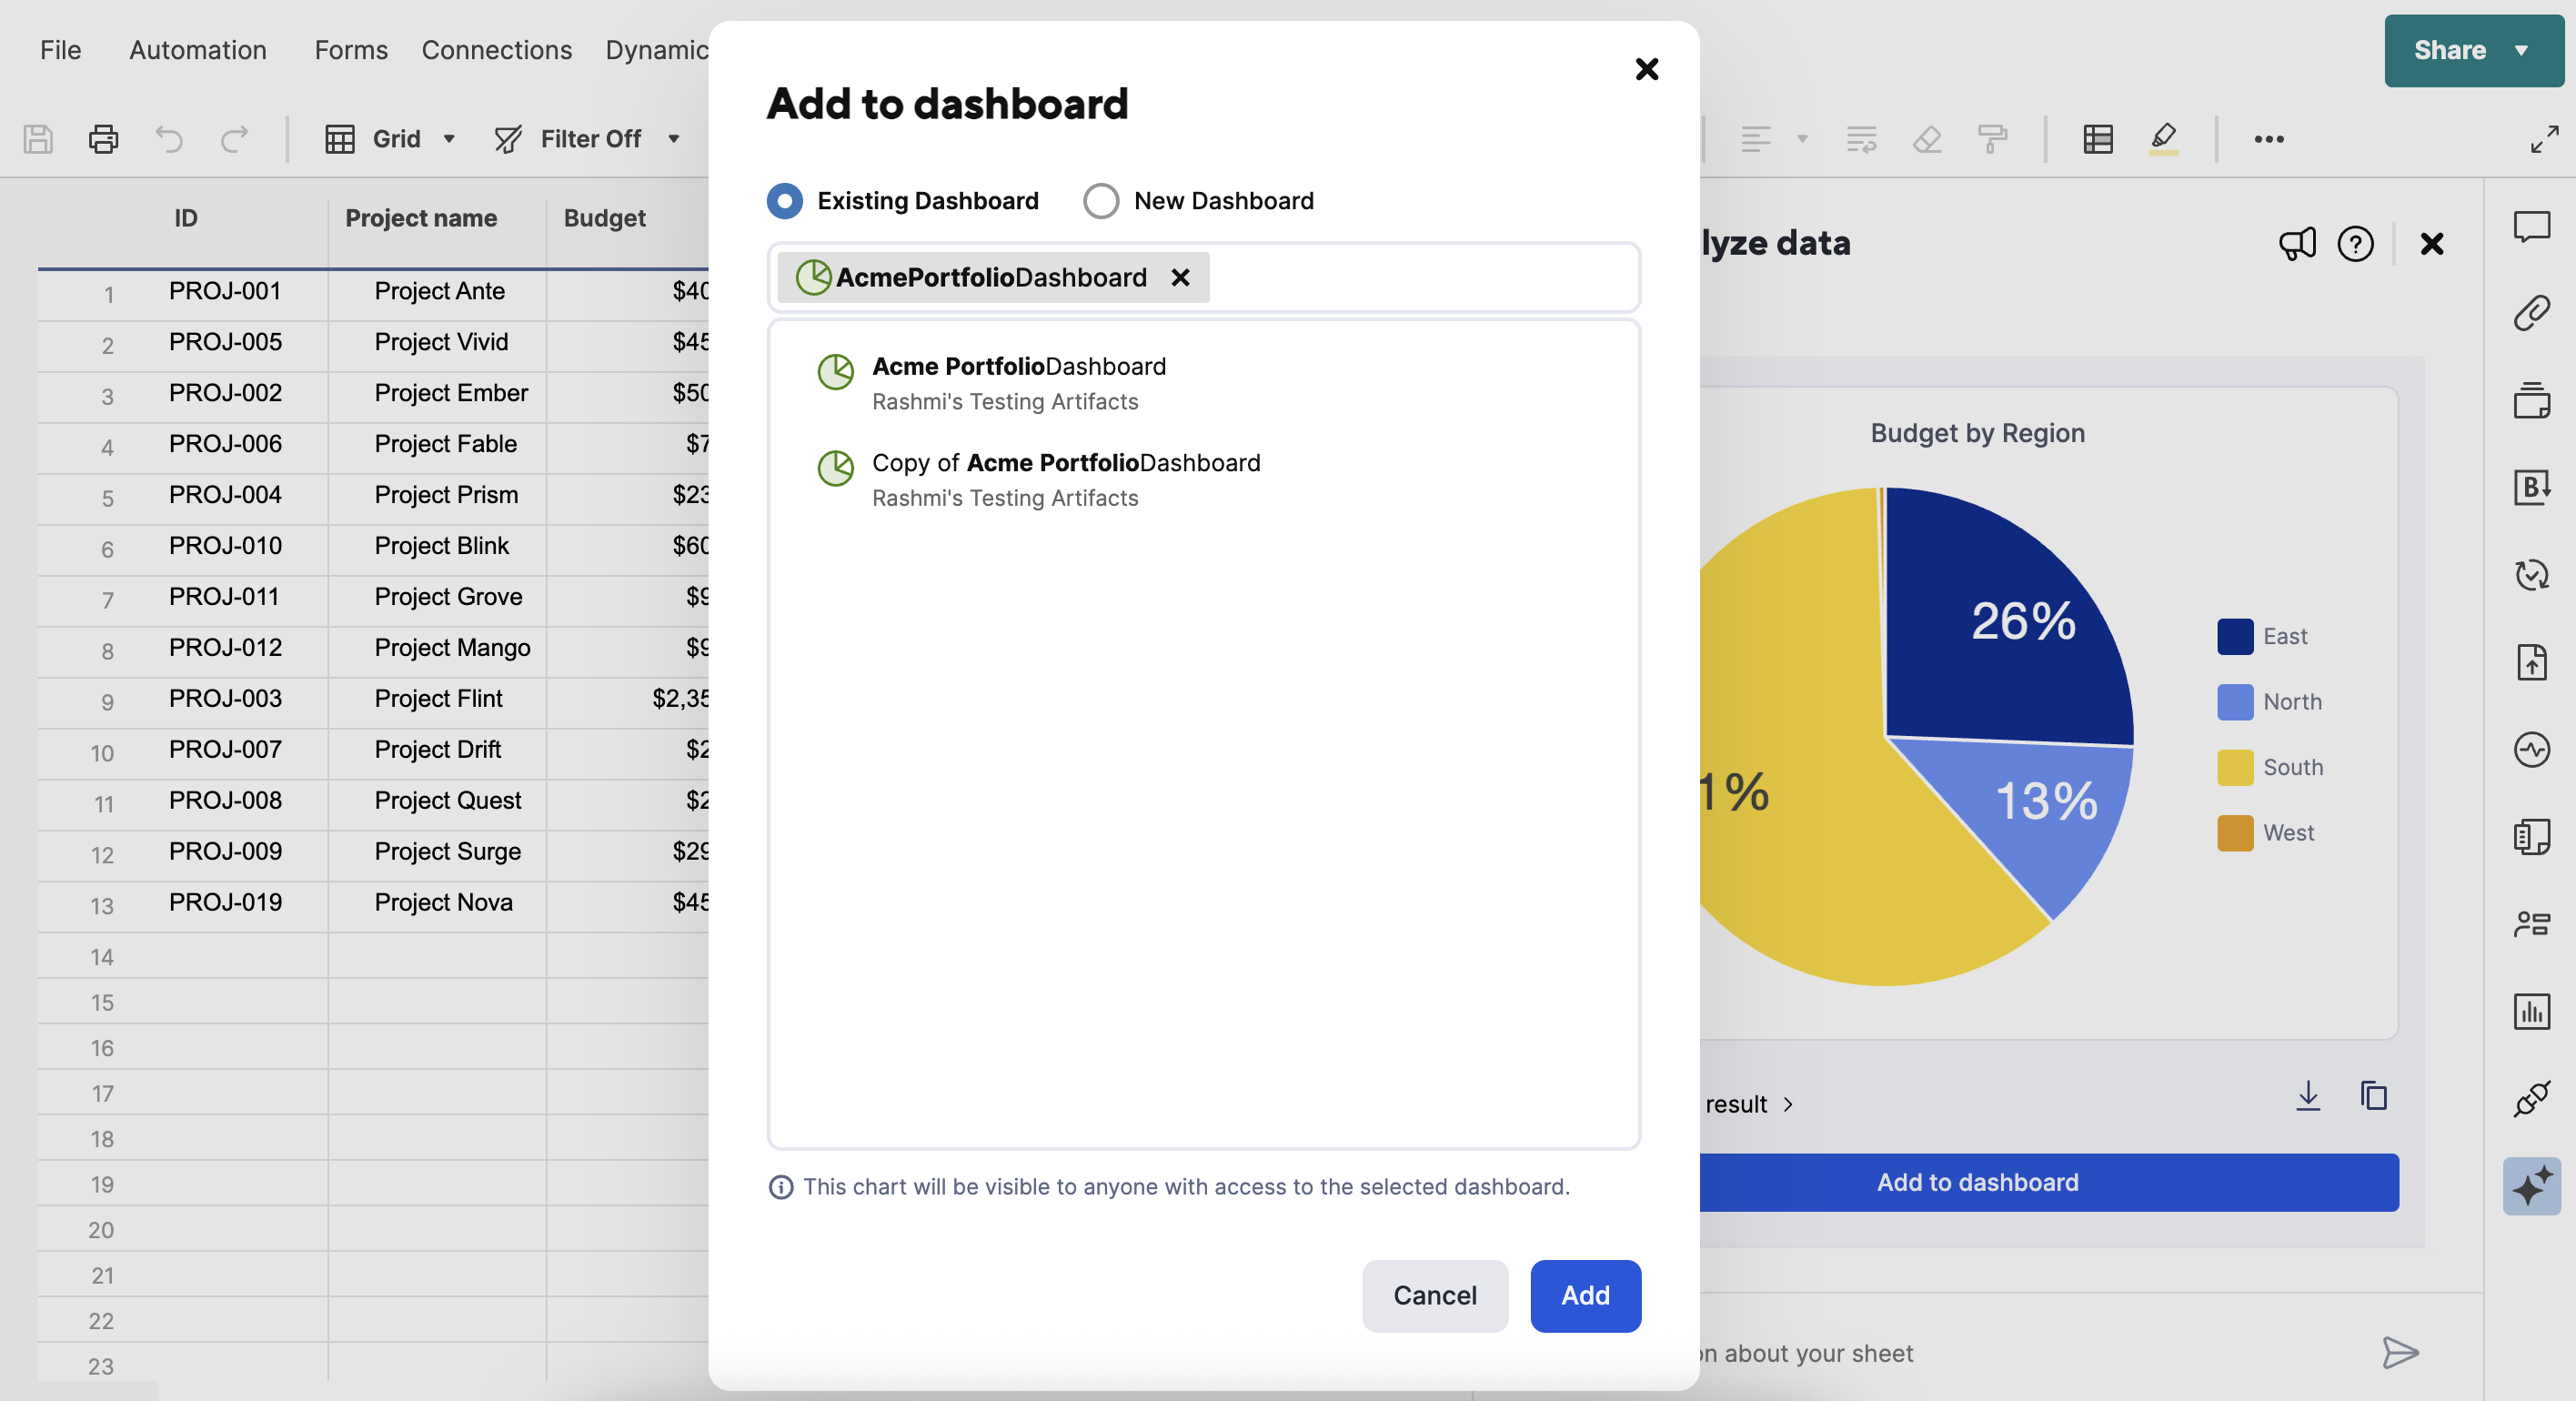
Use the analyze data AI tool within a sheet to instantly create and refine your chart, and click the new ‘Add to Dashboard’ button to add it as a widget to a new or existing dashboard. Learn More.
Environments availability: Commercial US, Commercial EU
Plan availability: Enterprise, Trial
Subscription Model Availability: Legacy Collaborator Model and User Subscription Model
Stay informed by following the Product Announcement category for updates on recently released product capabilities and enhancements. Once you click "follow," you can opt in for notifications when new content is posted and/or to receive these updates in the form of a weekly email digest.
You can also subscribe to product release updates for curated news of recently released product capabilities and enhancements for the platform of your choosing, delivered to your inbox. As new releases occur, you will receive a weekly email with news of what's released every Tuesday.
Comments
-
This is great!
Isis Taylor
🎓️ Core App and Project Management Certified 🏅
🌟Peer Connect, Mobilizer, and Early Adopter Program
Business Analyst Senior
-
Is anyone else having the experience of the chart link breaking after adding it to a dashboard? I was able to create a chart and add it to my dashboard, but when I return to the dashboard the link is broken.
Isis Taylor, MBA
Core App and Project Management Certified
Peer Connect, Mobilizer, and Early Adopter Program
-
1. Source Sheet or Report Access Changed
If:
- The chart is pulling from a report or sheet that had permissions changed or was deleted/moved,
- Or your access to that sheet/report was modified,
➡️ Then the chart widget can lose connection and appear as a broken link.
2. Sheet or Report Was Renamed or Moved
Even though Smartsheet should maintain links internally, moving a report/sheet to another workspace or folder can sometimes break the linkage in widgets.
3. Dashboard Saved While Source Was Still Loading
Sometimes, if you add the chart widget while the source report or sheet is still loading or hasn't fully rendered, it may save the widget with a broken or empty reference.
4. Report Filters Changed or Data Removed
If your chart is powered by a report and the data in the report no longer meets the filter criteria (e.g., empty dataset), the chart might disappear or show as broken.
PMO & Smartsheet Consultant
naeemejaz@hotmail.com
00923455332351
-
This is great! Cant wait to try it out
✅Did my post(s) help or answer your question or solve your problem? Please support the Community by marking it Insightful/Vote Up, Awesome, or/and as the accepted answer. It will make it easier for other to find a solution or help to answer
Cayla Davis | Technology Strategy and Optimization Manager
Halifax, Nova Scotia, Canada -
Love this feature.
-
@Elizabeth Matson will this functionality scale with Control Center templates as well?
-
@Chris Mondeau Currently charts generated with analyze data do not scale with Control Center. If you use a blueprint with an analyze data chart, the chart will show up as a blank space on the provisioned dashboard. This functionality is on our roadmap for the future, though, as we continue to enhance analyze data.