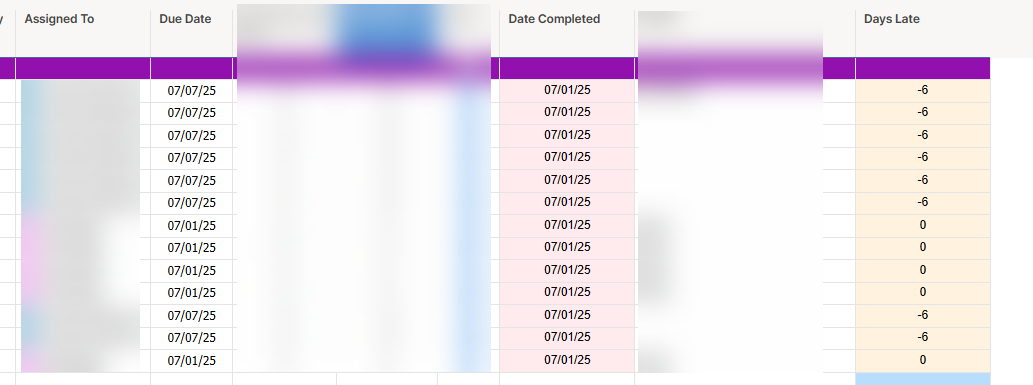
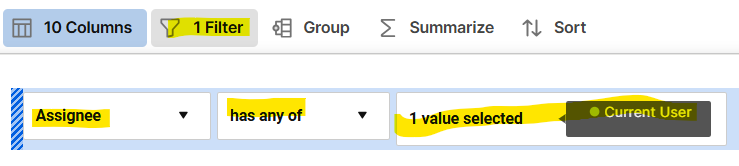
I need to create a graph, for two different people, tracking to see if reports are done on time or not. I need to use the assigned to column and then the days late column. Negative were done early, 0 were done on time (Day Of), and then positive numbers will be late.
Each graph would be just the one person, and then % completed on time/early, and then % completed late.
hopefully that provides enough information to help me create a formula for a dashboard!