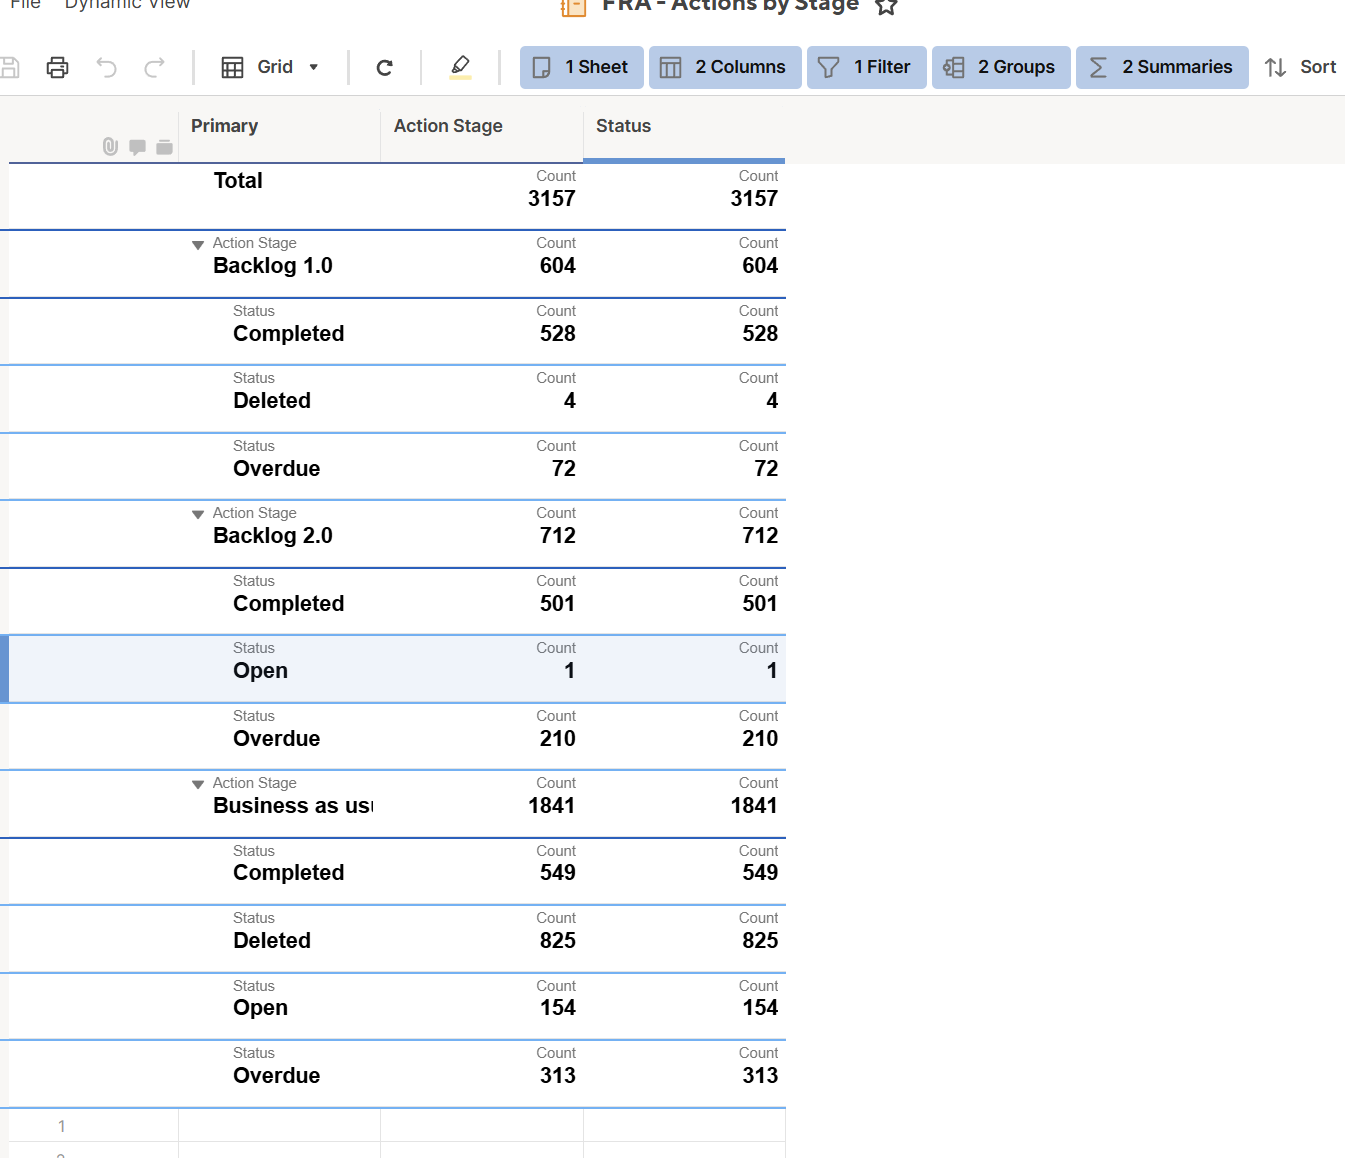
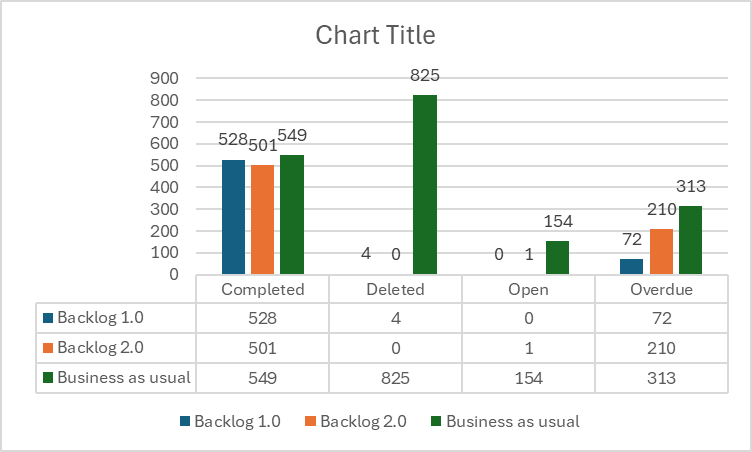
I have all the information in a Sheet, which has been imported. So I created a Row Report and selected the basic information (Action Stage = BAU & Backlog and Status = open, overdue etc). Within the dashboard column chart, I cannot seem to generate the Action Stage split out as BAU or Backlog along the horizontal axis with columns showing the quantity of each status. This is what I want……
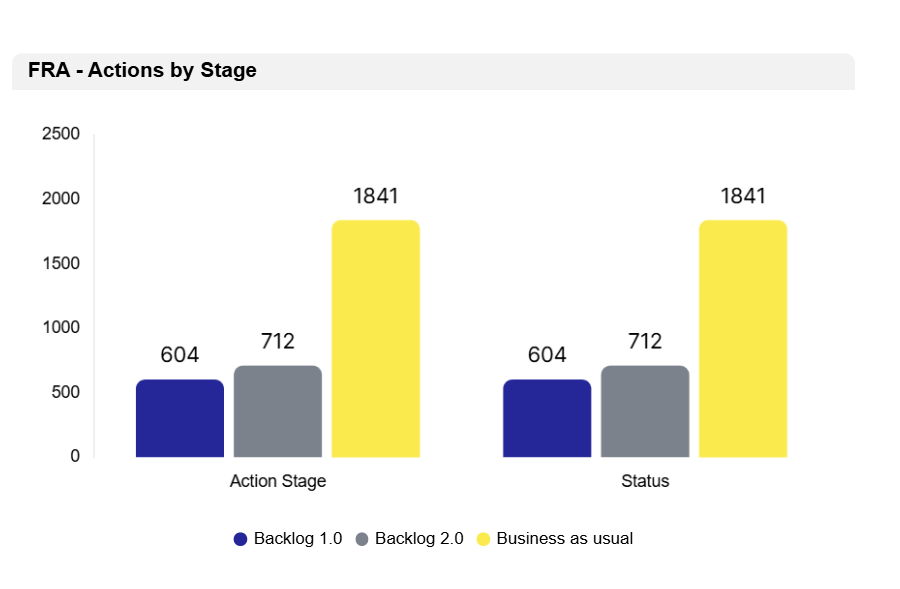
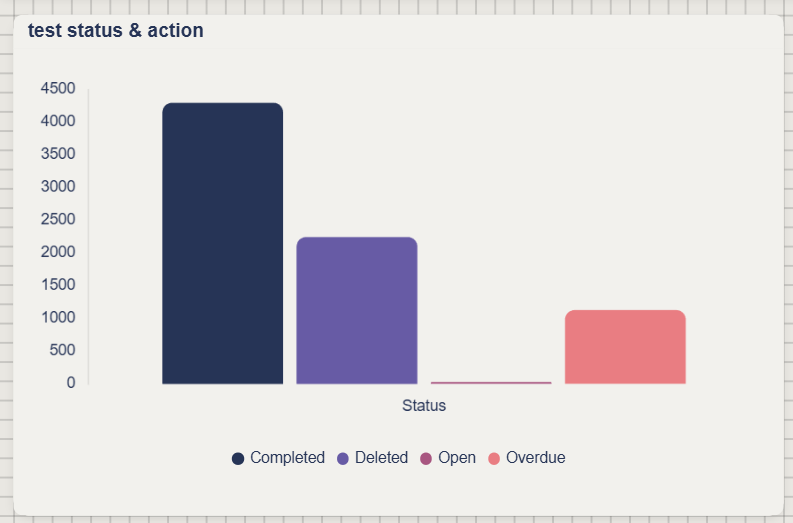
This is what I am getting….
I hope you can urgently help.
Thanks
Yvette