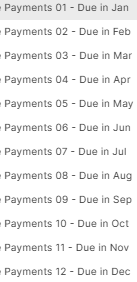
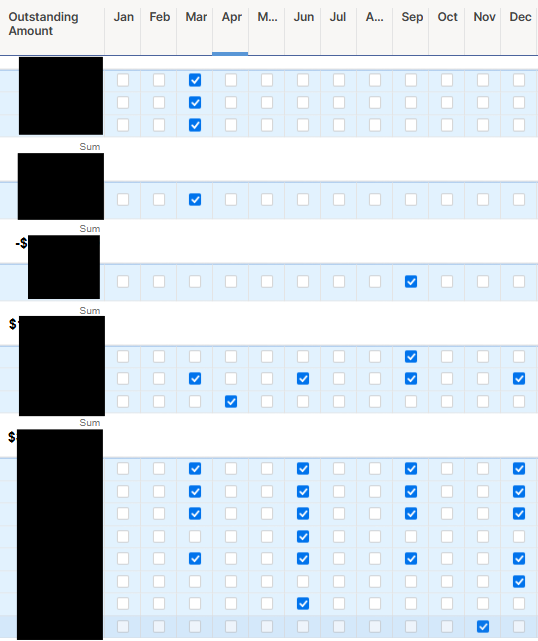
I have a tracker that automatically checks a box if something has to be paid in a certain month (based on a separate date column).
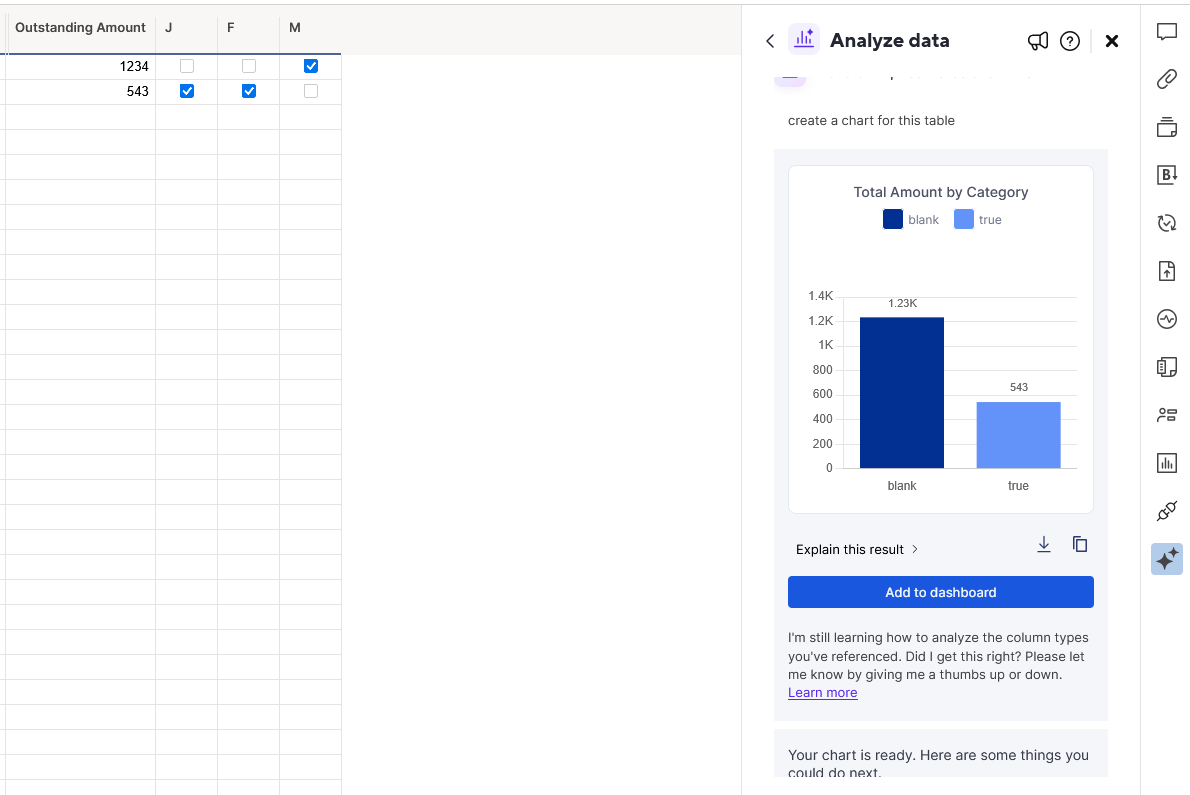
I'd like to create a bar chart on the dashboard to summarize the money due each month, but it won't allow me to select the checkboxes as a source on the bar chart.
My workaround was to create new columns for each month that checks to see if this box is checked, then it prints the amount, otherwise it prints $0.00.
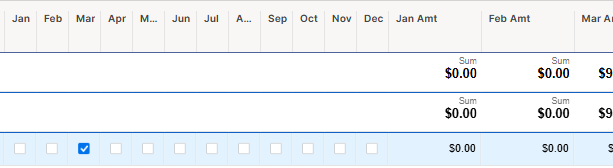
But this is creating 24 columns just so I can add the data from the second set of month columns to create that bar chart.
Are there any ways to make this more efficient to produce the bar chart results and other monthly tracker/report updates?