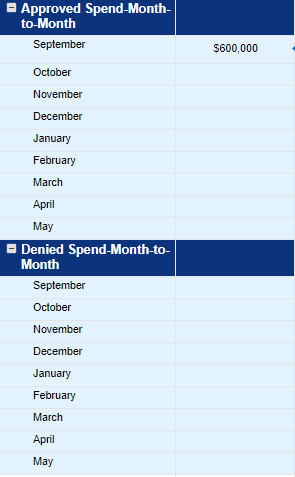
I am trying to create a graph for a Dashboard that will display the total amount of approved $$ within each month and total amount of denied $$ within each month. I will also need a rolling YTD total. So far this is what I have for the formula:
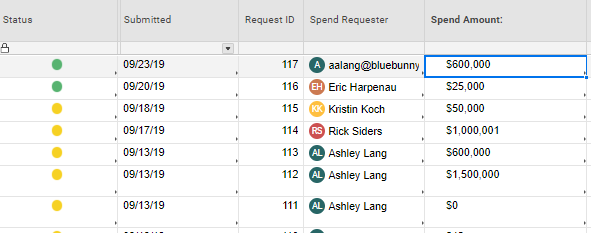
=SUMIFS({RSA Form Range 2}, {RSA Form Range 9}, "Green", {RSA Form Range 3}, DATE(2019, 9, 23))
I can not figure out to do a date range from 09/01/2019-09/30/2019 to show the total amount of either denied/approved $$'s.
Attached is the sheet I am getting the data for the sheet metrics to be used on a dashboard.