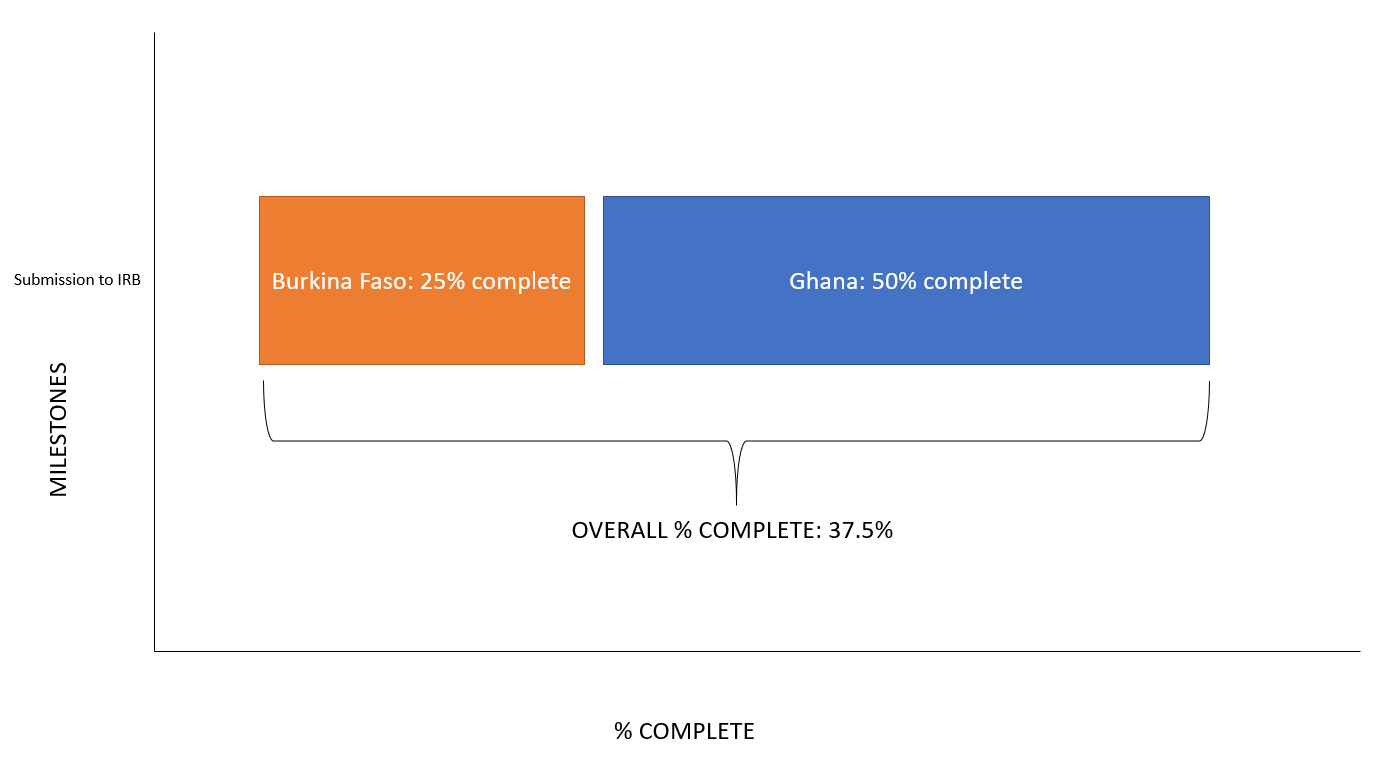
Stacked Bar Chart with Percentages
Answers
-
Hi Paul,
I'm cell linking each of the country percentages from a larger sheet. I just wanted to pull out the milestones here so I could make a chart with only the "need-to-know" info rather than everything.
In the source sheet the column is formatted for percentages.
Thanks again for your help!
-
My apologies. I used the SUMIFS syntax n the COUNTIFS. Try this...
=(COUNTIFS([Burkina Faso % Complete]@row:[PAHO % Complete]@row, @cell <> "") -1) -SUMIFS([Burkina Faso % Complete]@row:[PAHO % Complete]@row, [Burkina Faso % Complete]@row:[PAHO % Complete]@row, @cell <> "")
-
Hi Paul,
This time the formula worked, but its giving me weird percentages for the other milestones.
Any suggestions to fix this?
-
Lets give this a whirl...
=SUMIFS([Burkina Faso % Complete]@row:[PAHO % Complete]@row, [Burkina Faso % Complete]@row:[PAHO % Complete]@row, @cell <> "") / COUNTIFS([Burkina Faso % Complete]@row:[PAHO % Complete]@row, @cell <> "")
-
That solved it! I ended up just making my bar chart reflect the average, rather than all the pieces adding up to the average in a stacked way. But this was really helpful! Thank you!
-
Happy to help. 👍️
Help Article Resources
Categories
- All Categories
- 14 Welcome to the Community
- Smartsheet Customer Resources
- 64.2K Get Help
- 419 Global Discussions
- 221 Industry Talk
- 461 Announcements
- 4.8K Ideas & Feature Requests
- 143 Brandfolder
- 143 Just for fun
- 58 Community Job Board
- 463 Show & Tell
- 32 Member Spotlight
- 1 SmartStories
- 300 Events
- 39 Webinars
- 7.3K Forum Archives
Check out the Formula Handbook template!