Hi All,
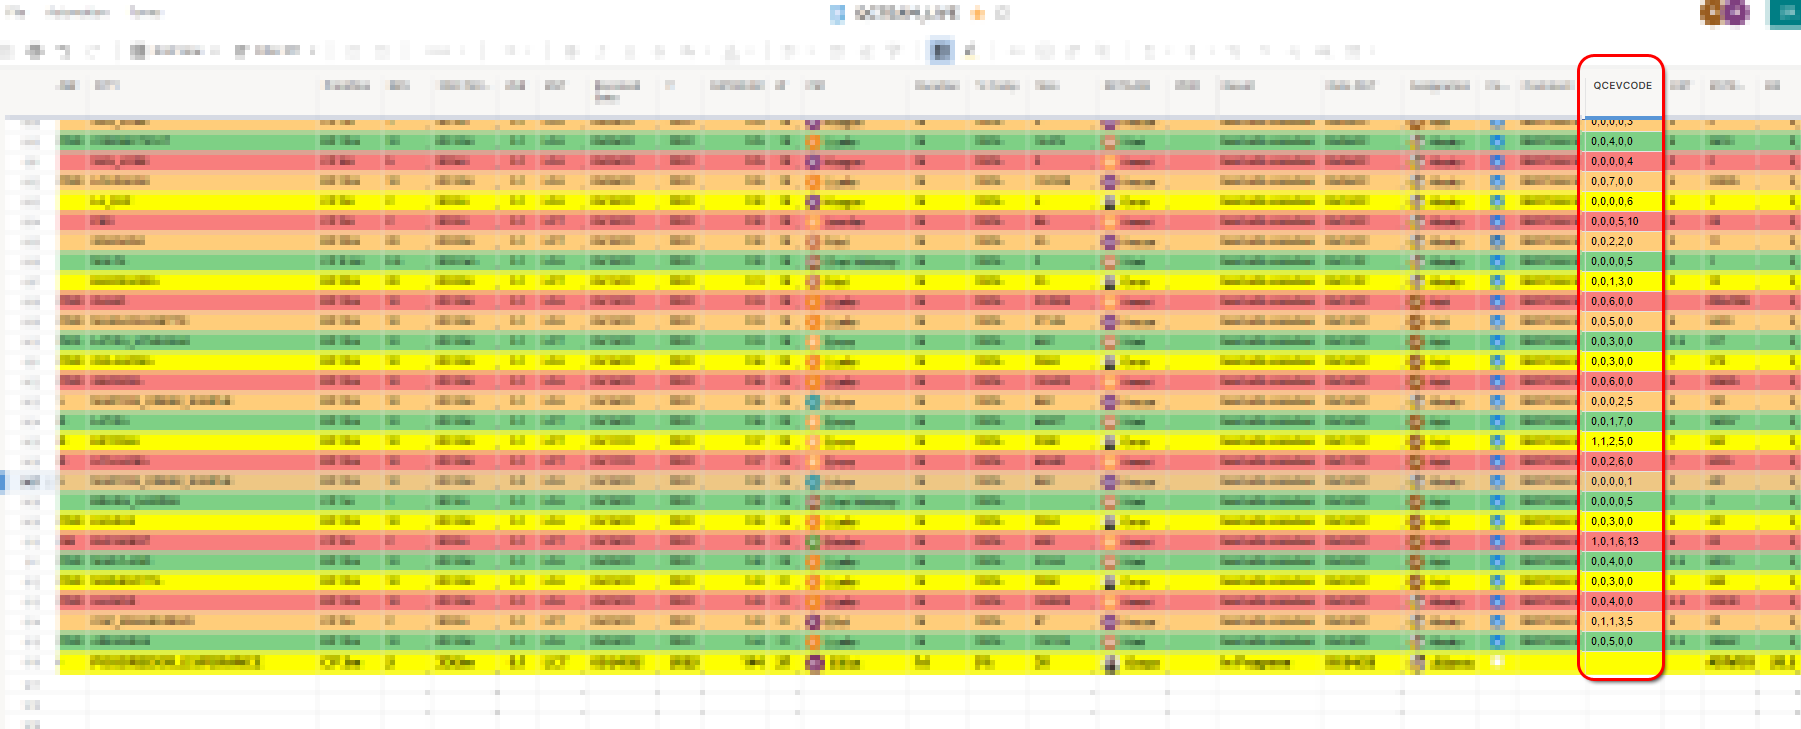
I have something like this in a column QCEVCODE:
1,3,2,5,1
for let's say 1000 rows, each one of them is the amount of issues for a type of dataset. I need to be able to export this to independent columns (or any other way to happen to come across with) so i can build a diagram, graphic showing percentage of certain type of issues in i.e Q1 2021, Q2 2021, etc
i want to automatically feed a dashboard item, meaning i know i can export to excel and do it from there but i want to inform my crew LIVE,
Is this possible? I guess yes!
Thanks in advance!!!
Alberto