Sign in to join the conversation:
H Folks,
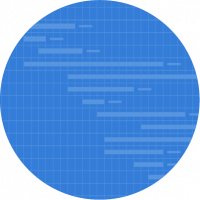
For some reason I have areas in my smartsheet plan that have grid missing, some are ok.
Does anyone have an idea how I can correct this and add the gridelines back please.
thanks
Mark,
Hi Mark,
That looks strange! Have you tried logging out/in? Is it only in one sheet it's showing like that? What are on those rows?
If you haven’t already, I would recommend that you reach out to the Smartsheet Support Team. Smartsheet Support Team
Have a fantastic week!
Best,
Andrée Starå
Workflow Consultant @ Get Done Consulting
Hello,
Happy to help investigate why some Gantt View grid lines are not appearing for some rows. The most common reason this occurs is that the row's background has been set to white utilizing the paint bucket tool in the toolbar. To correct this, select the row, then the paint bucket 'background' tool and set it to 'Automatic' instead of white. This will likely correct the issue.
Have a wonderful day. Thank you for contacting Smartsheet Support.
Cheers,
Eric
Smartsheet Technical Support
Thank you for that Eric, I have always wondered why that happened. Just made some adjustments to my conditional formatting and all now appears correctly. White fill was the culprit. Much appreciated.
Cheers, Paul
F&P Healthcare, New Zealand.
How can I delete old sheets I no longer use from my account?
I'm trying to display a task progress chart showing "complete", "late", and "not complete" in my dashboard and for some reason the chart will display as a column chart but it won't display as a donut chart even though I'm referencing the same report. I'd prefer to display as a donut chart as I think it looks better and is…
Hello, I am trying to create a chart widget in my dashboard, but I keep getting "Selected data cannot be charted. Please select a new range." error. The report I am using is already summarized in numeric value. What is funny is I have report that I created a chart widget in another dashboard, and when I use that same…