Hello
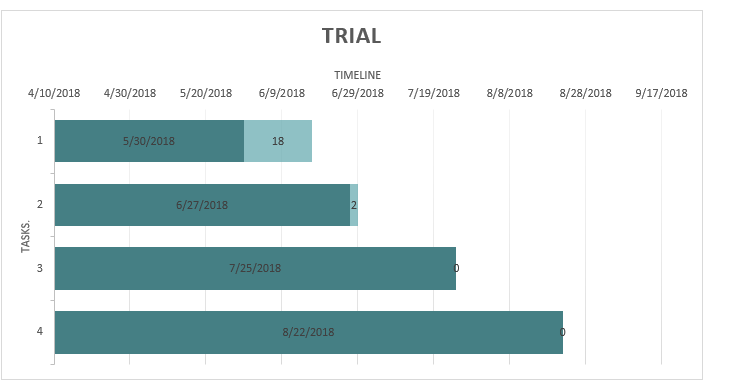
1. I am new to the smartsheet community and would like to know if it is possible to plot dates using the charts widget in the dashboard. I intend on plotting a stacked bar chart with dates and duration. (As show in Figure 1)
2. While using the clustered bar charts option, is it possible to a merge the bars, something like seen in the attached picture? Figure 2 was designed on excel. However is it possible on Smart sheet. If not, can this graph be imported to Smartsheet ?
Thank you