Welcome to the Smartsheet Forum Archives


The posts in this forum are no longer monitored for accuracy and their content may no longer be current. If there's a discussion here that interests you and you'd like to find (or create) a more current version, please Visit the Current Forums.

Reporting based on % of work

Alex Zarzar
edited 12/09/19 in Archived 2016 Posts

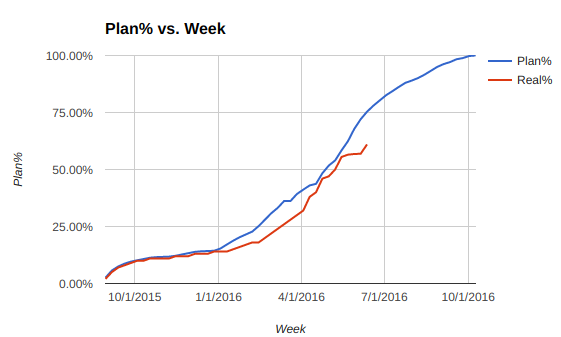
I need to have an initial graph of the amount of planned work schedulled for each week of the project. The "X" axis will have each week and the "Y" axis the % of work to have done.

I am sharing a graph as an example. The blue line will be the planned baseline project. The red line the real work on a weekly basis.


Any ideas on how to do this using Smartsheet?


Screenshot 2016-06-27 at 10.25.56.png

Comments

This discussion has been closed.