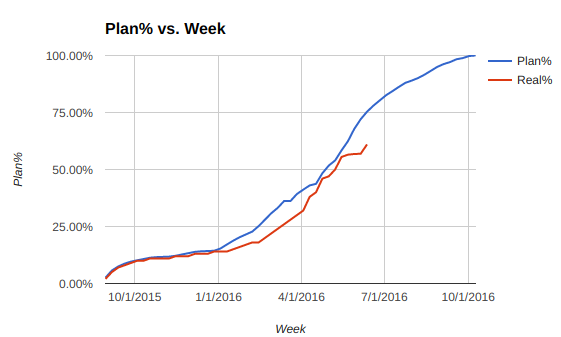
I need to have an initial graph of the amount of planned work schedulled for each week of the project. The "X" axis will have each week and the "Y" axis the % of work to have done.
I am sharing a graph as an example. The blue line will be the planned baseline project. The red line the real work on a weekly basis.
Any ideas on how to do this using Smartsheet?

