Please give me your input on the best way to structure my sheet data to achieve the reporting/summary options desired. The current data is being migrated from an Excel workbook with ~20-30 column fields per row which makes it difficult to use for our project management/collaboration. But Thus far using the construction facilities template set I cannot get all of the the data summaries/views to function correctly.
My data:
Rows - individual job/project records for single family residential construction work;
Columns - Various data types/data points relating to the progress of each individual job record; i.e. start date, phase/stage of progress, sub contractor crew assigned to specific phase of job, date phase scheduled, date completed, a few fields for material quantity takeoffs,
My goal: structure the above data in such a way that field personnel are able to easily and quickly filter down to a set of job records for viewing/updating & more easily understanding where jobs are in the process to improve management of the jobs.
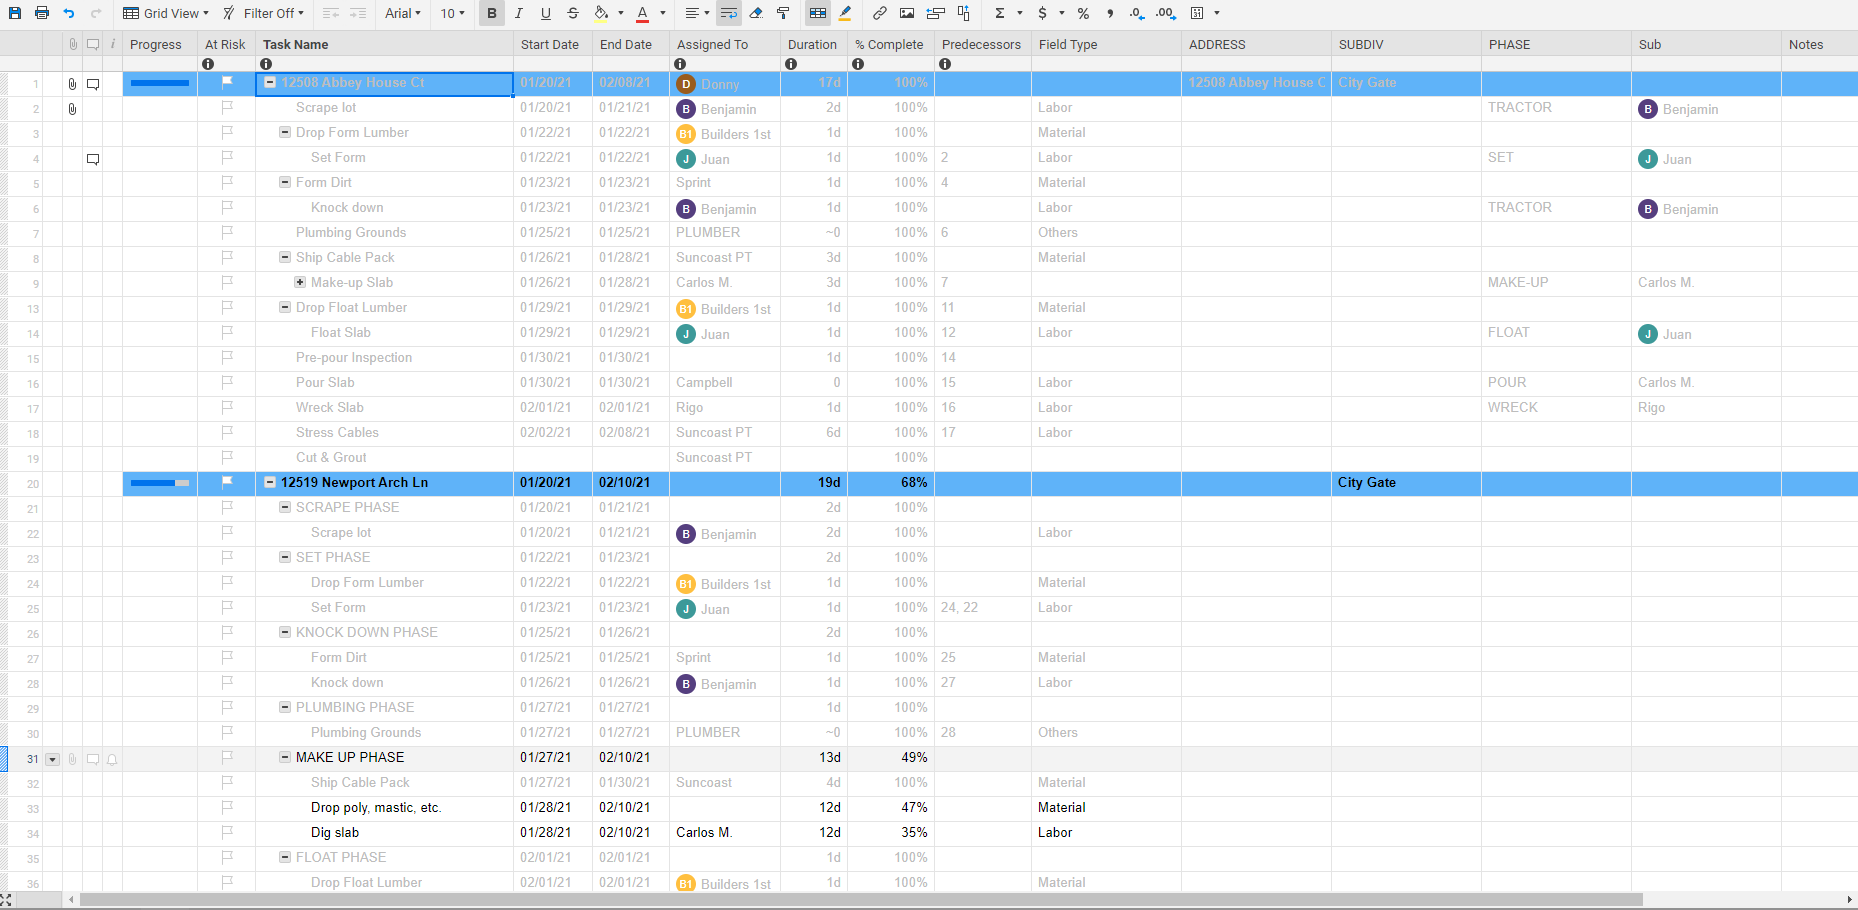
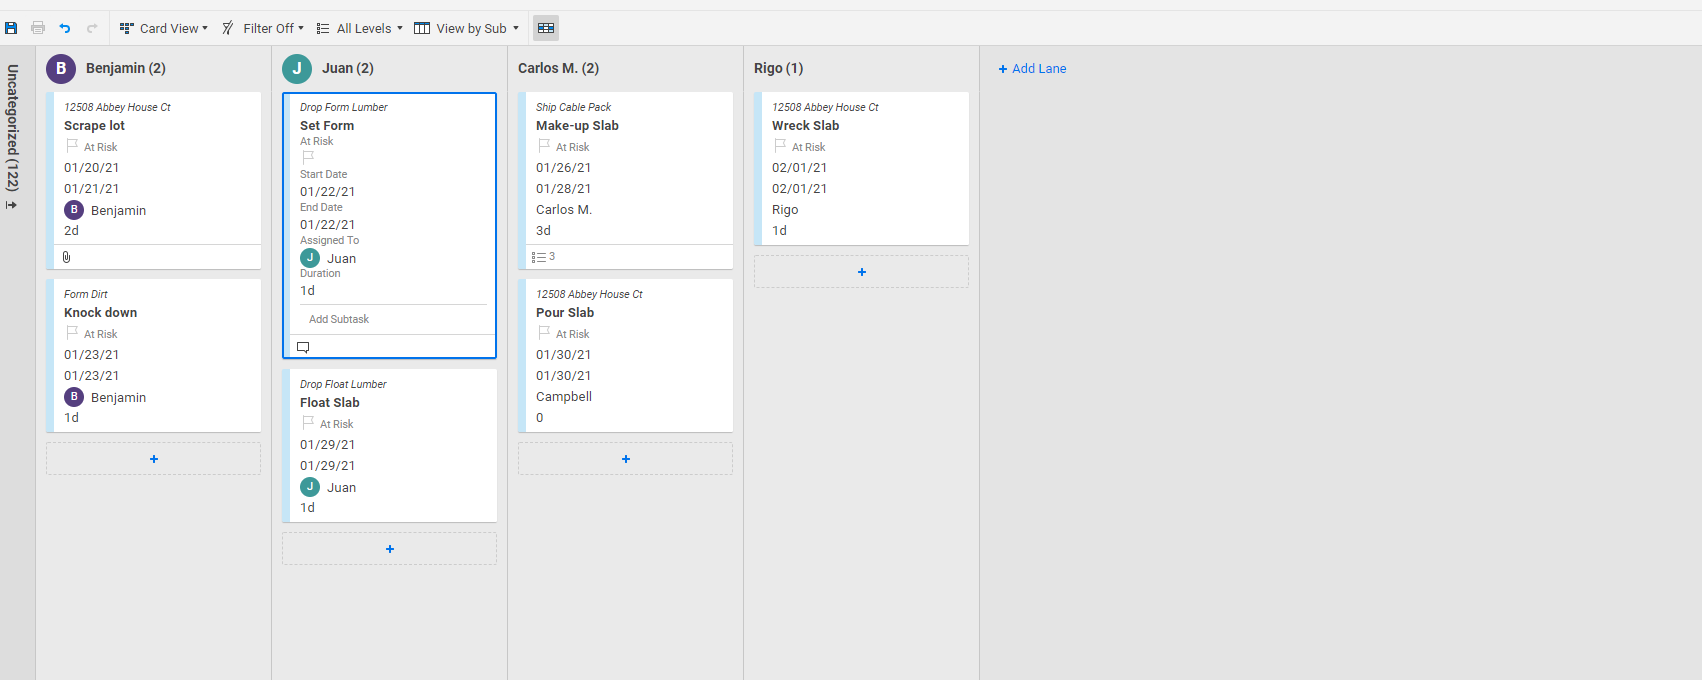
Card view seems to be the main culprit currently. Using task-sub task layout in grid view, I structure the address of each job record as the main project entry, then parent/child tasks below this.
I am hoping to be able to use card view to quickly filter/summarize the following data points:
- job addresses per subdivision
- job/labor stage/phase per subdivision; x# jobs at beginning in subdivision 1, x# jobs at end in subdiv 1, etc.
- subcontract labor crew by subdivision; This will allow us to easily communicate to our crews what work they have currently scheduled and upcoming
- jobs by employee per subdivision; this will hopefully be used to summarize their daily task list/agenda in each subdivision.
Thus far I can achieve 1 or 2 of the above but not all of them using the template set for construction management.
Any advice is greatly appreciated