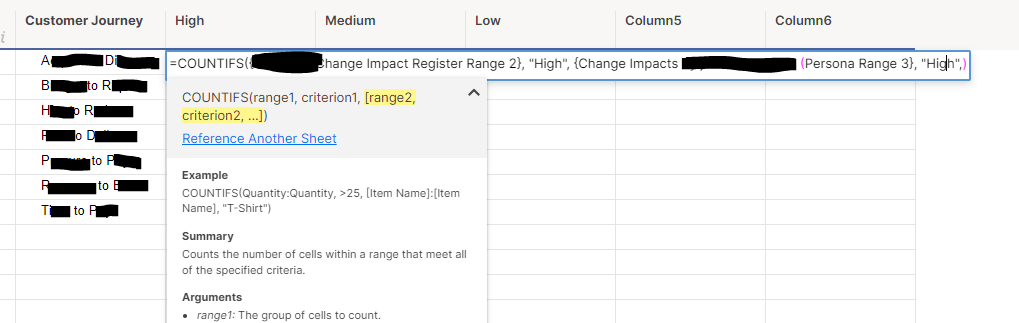
Hello, I am struggling to gather data together from multiple data sets to represent as a stacked bar chart. I have large spreadsheets that use dropdown options for data I need such as customer journey and impact rating (high, medium, low) there is a lot of other data in these sheets as well and they are over the 100,000 limit so I am trying to be specific when inserting a data reference (difficult with how the sheets are set up that is out of my control).
Based on things I have read here I have created a metric sheet where I need to pull agency specific information and use COUNTIFS formulas to count the number of High, Medium and low impacts per customer journey. I am struggling to pull the data and a little frustrated that all this work is required for one tile on a dashboard that then needs to be duplicated for several agencies.
I am pretty sure I am super off with the formula and have spent too much time trying to work it out!
Can someone please help me?
Thanks,
Elise

