Best Of
Re: Adding options to drop down menu
Hello @joannlynn,
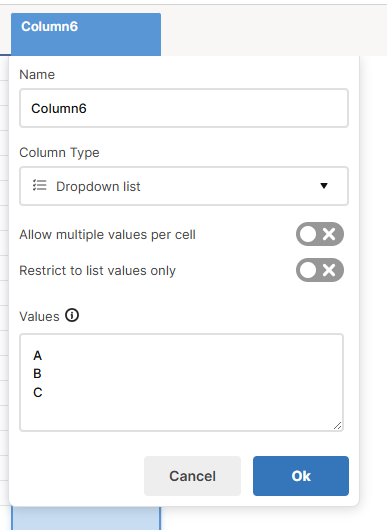
You must be a Sheet Owner Admin. if you are, then double-click the column header and you will see the option to add to the list.
All the best,
-Ray
 Ray Lindstrom

Re: New Here
Hello JoAnn!
I'm Marcela, Smartsheet Community Specialist. I help moderate the forum, and I'm based in Costa Rica. Nice meeting you!!
Welcome to the Smartsheet Community. I'm glad to have you here, and I hope you get the best out of its collaborative environment! You might as well take a look and say hi to other awesome Community members who have introduced themselves in this thread.
Cheers!
 Marcela
Re: Creating a new report in Smartsheet
Hello @joannlynn,
To add to the comment above, you can find more information about Reports in this Smartsheet Help Center article.
Cheers!
Marcela
Re: Creating a new report in Smartsheet
Howdy! Go into your workspace (leave the "browse" section) and select the "Add to Workspace" button at the top and click "Report".
 jjg279
Re: Work around for Data mesh or Data shuffle if not available in my current account using Business Plan
Hi,
I hope you're well and safe!
Two options.
1️⃣ 3rd-party service
2️⃣ Smartsheet API
Would any of those options work/help?
I hope that helps!
Be safe, and have a fantastic day!
Best,
Andrée Starå | Smartsheet Expert Consultant & Partner / CEO @ WORK BOLD
✅ Did I help answer your question/solve the problem? Please support with💡 ⬆️ ❤️, and/or ✅ Answer. This will make it easier for others to find a solution or help answer. I appreciate it, thank you! 🙏
 Andrée Starå
Re: Work around for Data mesh or Data shuffle if not available in my current account using Business Plan
Noticing now that I might have misunderstood.
Can you elaborate?
Please share some screenshots and/or additional information. (Delete/replace any confidential/sensitive information before sharing.) That would make it easier to help.
I hope that helps!
Be safe, and have a fantastic day!
Best,
Andrée Starå | Smartsheet Expert Consultant & Partner / CEO @ WORK BOLD
✅ Did I help answer your question/solve the problem? Please support with💡 ⬆️ ❤️, and/or ✅ Answer. This will make it easier for others to find a solution or help answer. I appreciate it, thank you! 🙏
Andrée Starå
Re: Is there a work around to do the dropdown list type will automatically update master file
Hi,
I hope you're well and safe!
FYI - I've answered your other post.
I hope that helps!
Be safe, and have a fantastic day!
Best,
Andrée Starå | Smartsheet Expert Consultant & Partner / CEO @ WORK BOLD
✅ Did I help answer your question/solve the problem? Please support with💡 ⬆️ ❤️, and/or ✅ Answer. This will make it easier for others to find a solution or help answer. I appreciate it, thank you! 🙏
Andrée Starå
Re: Text Values showing as zeros in Scatterplot
I think your base problem might be your thinking about what you are trying to represent in the graph. If you solved your scatterplot problem it is just going to look like your line chart without the connecting lines - which you state doesn't present well. Though, if you DO want this, graph another column that has all 0s as the values, make it the first series graphed and set the display color to white so that it overwrites all the others- that might work. You can see right now your orange series overwrites yellow and blue at the 0 line, just make an additional white one and you won't see the marks. PERSONALLY, if you are going to do this, I'd duplicate the entire dataset in a helper sheet and rather than "" for the empty cells I'd use something like 80% of the minimum value of the real data so that the Y axis doesn't go all the way to 0 for no reason. If you do that, obviously your white series needs to be that same value.
If you are trying to show the trend over time of your different datasets, the line chart with missing values interpolated may make the most sense - in which case, rather than having no data when there isn't a value you'd want the data from the cell above (or a smooth transition to the next point depending on the nature of your data). Any kind of interpolation is going to require the ability to reference other cells and rows which (if you want to use column formulas) is likely going to require a helper column called "row" as described in the accepted answer to this thread: Is there a way to reference the row above? - Smartsheet Community
If the times when the value drops to zero is relevant then the scatter plot and the line plot are both showing what you need them too by making the zeros visible.
If you are trying to show some other relationship you may want to consider manipulating your data in a helper sheet prior to graphing entirely (I do this OFTEN, I very rarely want to graph my data in the format I want to capture it in; any dashboard of mine usually has at least 2 helper sheets and a couple of reports that are kept hidden from the users).
Historically, when helping people with data visualization issues, my advice has been to use pencil and paper to draw the ideal graph you want and at least 2 or 3 alternates that would also work (just to make sure you actually like your first pass "ideal"). THEN figure how your data would need to be manipulated to allow that to be generated by the computer. ONLY THEN start messing with the graph options of whatever program you are using.
In your case - what do you WANT displayed when one term is blank but the others aren't? Should the line continue through level? Slope to the next point (and what do you want if there ISN'T a next point)? Disappear? Something else?
 Jgorsich
Re: API Deprecations announced today seem to suggest no replacement for GET TEMPLATES
Adding here just yesterday after days of no word got confirmation from support that they can escalate this question.
sgolux