Best Of
Re: July Question of the Month - Join the conversation and receive a badge
I had two main goals for the year.
The first, which was Smartsheet related, was to push the growth of Smartsheet through the business with the help of one of my colleagues. Together we have reached all areas of the group functions and are building solutions to grow further in to many of the different brands. The business are now looking to utilise some more premium features as a result.
The second, which was a personal goal, was to be healthier and lose some weight. It was a slow start until March, when I got a kick up the bum that I needed. Almost, 4 months later and I am midway through a couch to 5k program, swimming twice a week and the most exciting part, over 27Kg down (or 4 1/2 stone to those of us from the UK).
Both goals are being well and truly smashed and I could not be happier! 😁 🎉
 John_Foster
Re: Smartsheet recognized as a Customers' Choice in the Gartner® Peer Insights™ + Giveaway
Hello everyone!
I do quite a bit of freelancing, and Smartsheet is a big part of my work. Recently, I helped a very distraught doctor who worked at a business with limited funds. He was trying to figure out how to test his students on their practicals in real time using technology. After the exams, he also wanted the ability to send results both to the students and to the facilitators.
I built a solution in Smartsheet that allowed him to grade his students on over 400 questions, using more than 400 columns! I set up custom automations, workflows, and email notifications so results could be distributed quickly and efficiently. He was thrilled with the outcome and was able to increase his efficiency by over 50% as he transitioned from paper-based exams to a fully digital process.
This was one of my proudest projects since it made such an impact on his work.
 Paul.Woodward
Re: Summary Reports: No access to the base report
Thank you so much this solved my issue!
 KellHobbs
Re: 🚨 [Feedback Requested] Would commenting directly on Dashboards help your team? 🚨
I really like the idea of having the ability to have stakeholders or anyone be able to comment or add comments to a Dashboard. I even thought of the idea (and IF POSSIBLE) to be able to turn on/off the comments feature or be able to toggle it off or on, depending on the users or maybe within a certain timeframe? Could it also be only visible to the Admin or Owner of the dashboard, too?
Recently I had to have an internal client review the dashboard I created for his online course tracking and to get his feedback I was able to make a static PDF of the dashboard and add it as a Proof for his review. I gathered his comments and annotations through the Proofing feature to capture what he needed, liked, and what to do away with.
To answer some of your questions in your post here are my thoughts:
- Have you
everwished you could comment directly on a dashboard? Maybe once or twice. I do worry that stakeholders can really go rogue with their comments and would open up a door of continuous feedback. I also would not want someone else to see stakeholder comments or feedback thus the ask to have it only visible to the Dashboard Admin or Owners? - Do you take screenshots or write long Slack/Email messages instead? I used Proofing and added a static PDF to gather feedback and explain the why's/how's/and where's.
- Would annotations make this better — or just add noise? It will definitely add noise IMO. But can it be contained noise (i.e. the ask of Admin and Owners can be able to view or toggle off and on)?
- Do you feel the need to have a lightweight approval mechanism built in to Dashboards to get sign-off from your stakeholders? This would be interesting to see on what this would look like. Would it function similarly as the Proofing is setup for review and approvals? Tell me more!
 melissa.garcia
Re: Form Basics
Could you make the field the question, and the answer a drop down (from Strongly Agree to Strongly Disagree) displayed as radio buttons?
 KPH
KPH
Re: Receiving multiple emails from single workflow
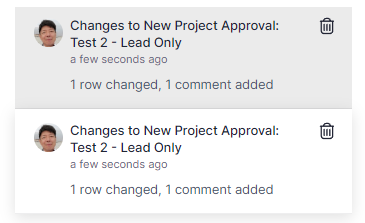
Thank you for sharing the screenshots.
I was able to recreate the duplicate alert problem you reported.
As I tested, one way to prevent this is to send alerts not to "Specific People" but to "contacts in a cell".
As shown in the image below, I added CC3 Alert multiple contact columns for this purpose.
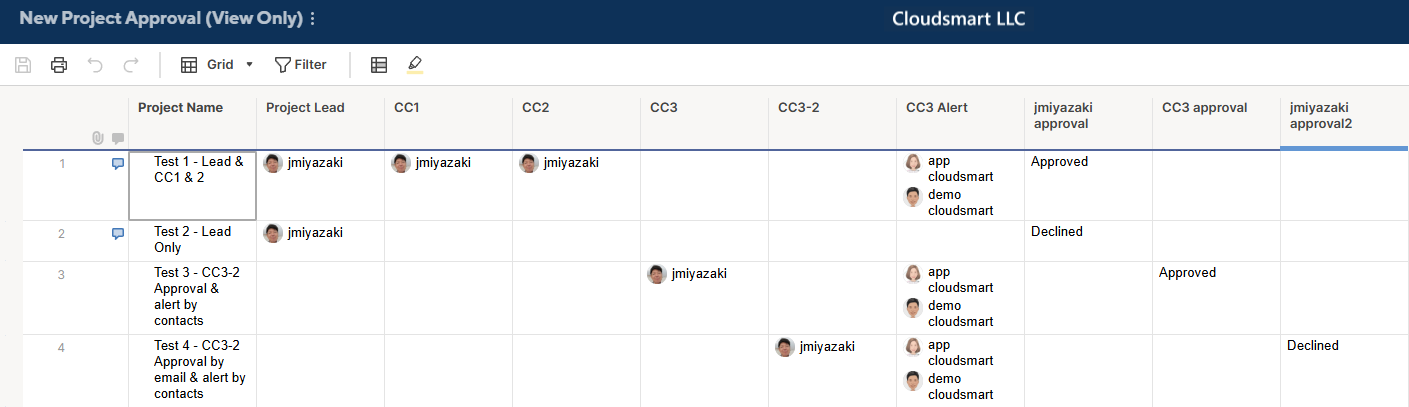
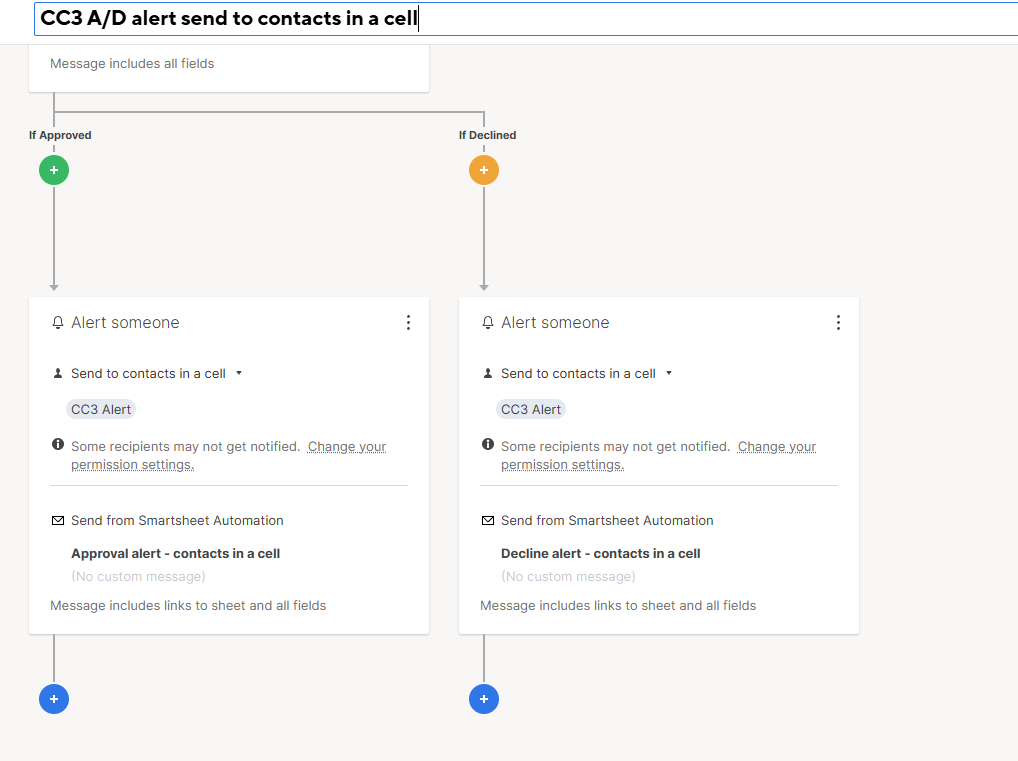
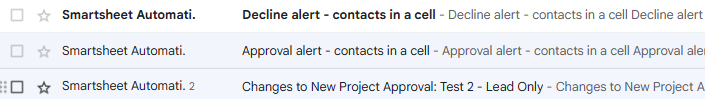
The workflow below utilizes "Send to contacts in a cell" for both approval and alerts.
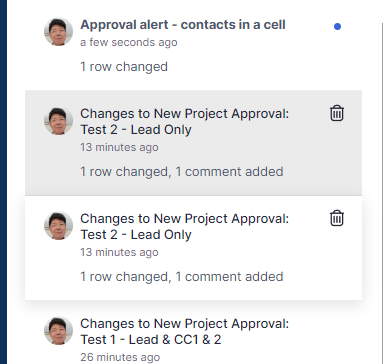
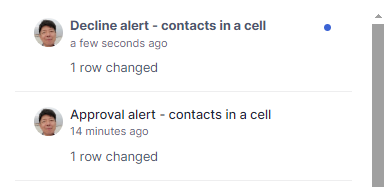
And, as shown below, the contact in the CC3 Alert, or demo@cloudsmart.jp, received only one alert.
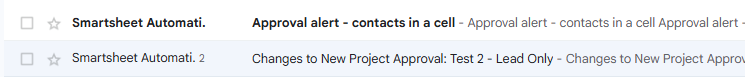
Note in Gmail, the older message has 2 after Smartsheet Automation, as "Smartsheet Automation. 2", meaning there are duplicate messages.
The same was true even if I used "Send to specific people" for the Approval request, but used "Send to contacts in a cell" for the alerts.
I do not understand why sending to specific people duplicates the alert, but using this method should stop your problem.
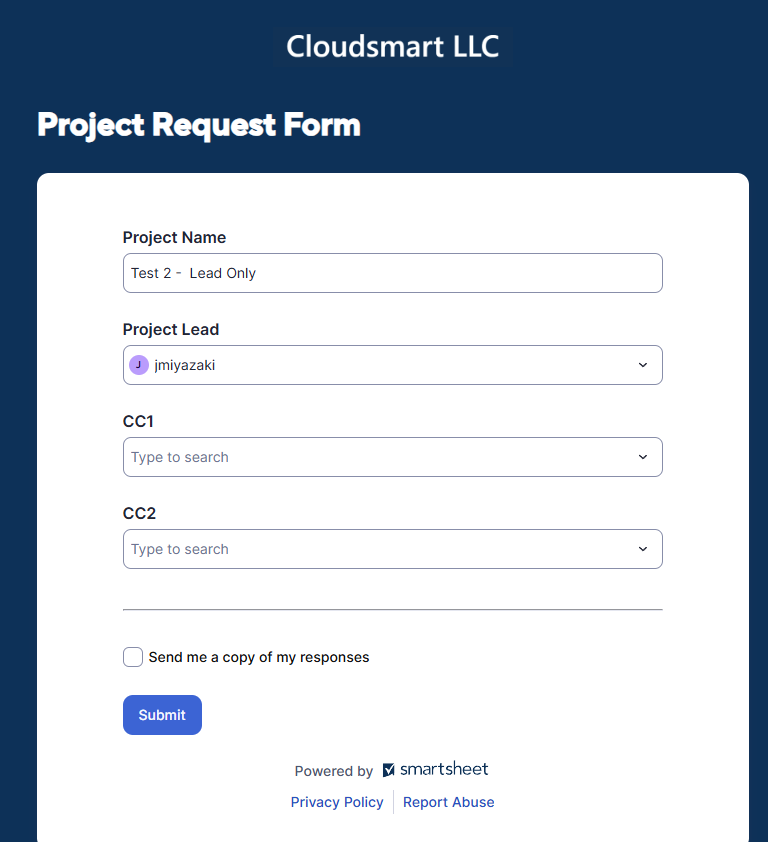
The following images are my test to replicate your issue.
I first suspected the possibility of being selected for all assignments, Lead, CC1, and CC2.
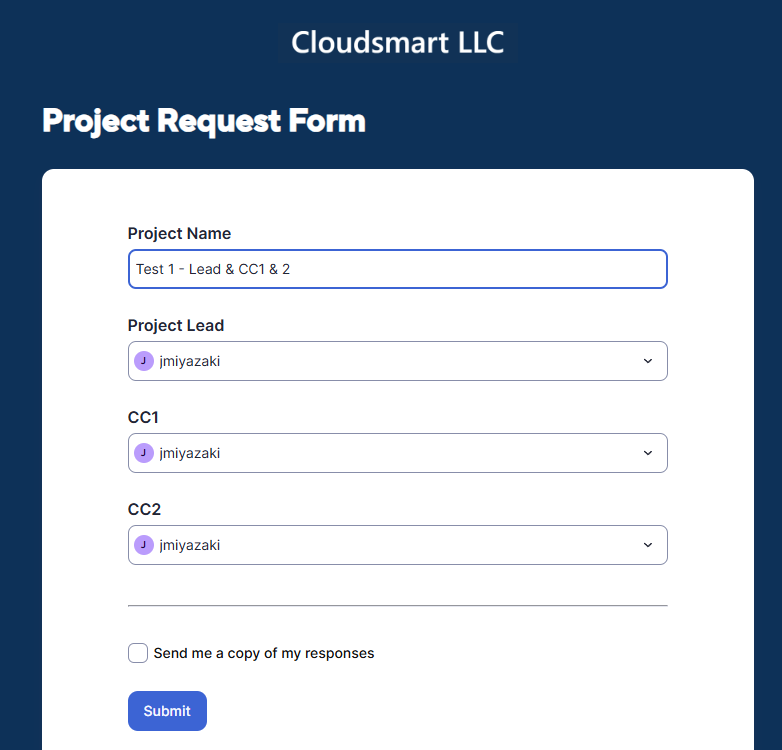
The setup caused the duplicate issue, but that was not the root cause, as assigning to a single role also resulted in duplicate issues, as shown later.
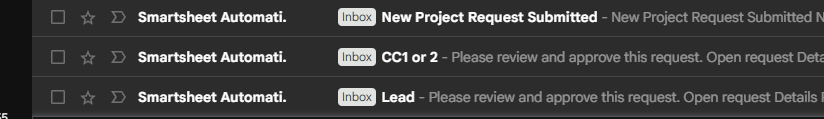
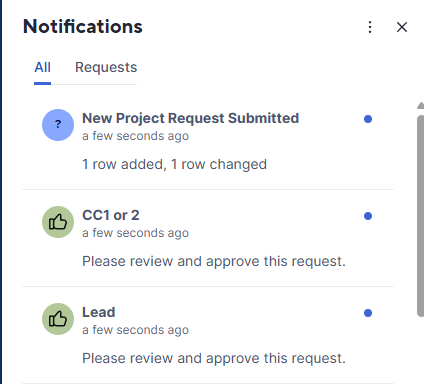
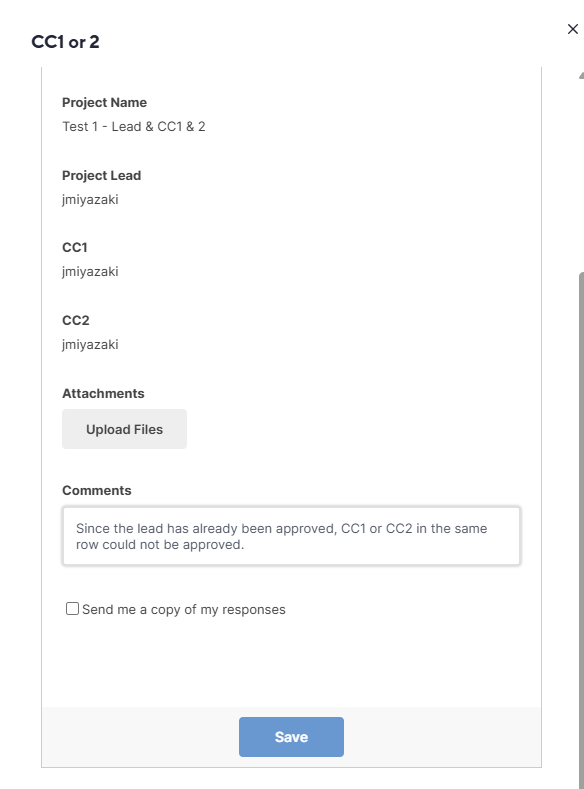
An interesting observation is that although Smartsheet automation sends update requests through different workflows, one for Lead and the other for CC1 or CC2, only the first one is valid, and the second acts more like an update request.
As shown below, the second request does not have an "Approve/Decline" button.
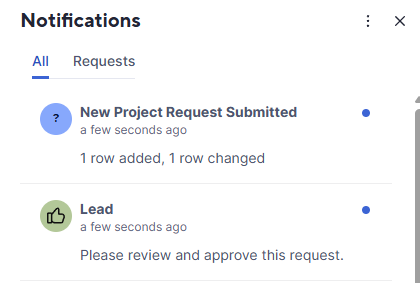
Assigning to a single role also resulted in duplicate issues.

Re: Form Basics
And to follow on from what @Corey W. says, you can also add more text as Help Text, if the questions are very long. The field name is just for your reference. The user will see the Label and Help Text. If no Label text is supplied, the Field Name will be used.
KPH
Re: Form Basics
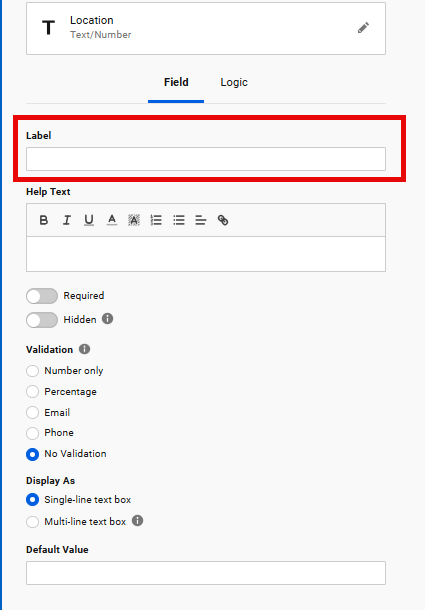
@Robin Johnson You should be able use the label field to accommodate the longer questions. Then just use something short for the column names, like "Question 1". They don't have to match.
Hope that helps.
Thanks!
Corey W.
Re: 🚨 [Feedback Requested] Would commenting directly on Dashboards help your team? 🚨
I think this is a great idea, and really the next step in being able to fully collaborate inside of Smartsheet. Would this also be coupled with Insights to provide a theme or action list that can then be used by a PM to use as a possible change log?
In addition, being able to somehow have versions no a dashboard to track this would also be great, to again drive that scalable growth over time!
 Antonie B
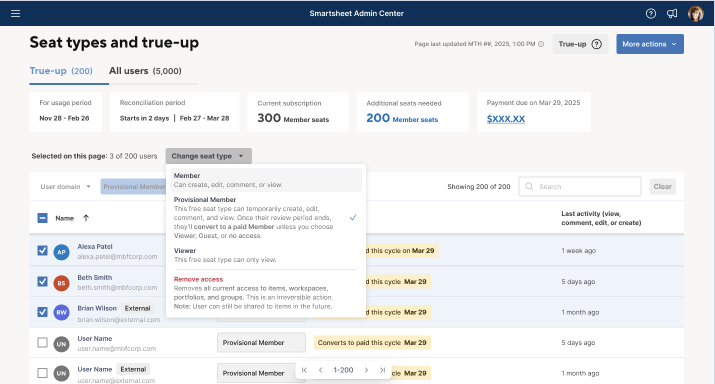
We've added bulk seat upgrades to the 'Seat types and true-up' screen
July, 15, 2025
We've added the ability to upgrade seats to Member on the 'Seat types and true-up' screen for more scalable and systematic management. Learn More
Environment Availability: Commercial US, Commercial EU, Commercial AU
Plan Availability: Pro, Business, Enterprise
Subscription Model Availability: User Subscription Model
Stay informed by Subscribing to receive product release updates for curated news of recently released product capabilities and enhancements for the platform of your choosing, delivered to your inbox. As new releases occur, you will receive a weekly email with news of what's released every Tuesday.
 Ryan Dougal