Hi Everyone,
This is actually my second post and 3rd issue I have had on this topic. My chart colors won't stop changing when values go to 0 then back to a positive number again!
My 1st solution attempt I tried adding +0.0001 to the end of each formula, but this kept multiple 0's on the display which made part of my chart unreadable.
My next attempt was making all of my values go above 0, assigning a color, and then resetting it back to its actual number. This unfortunately did not work either and I attached some pictures below to show this.
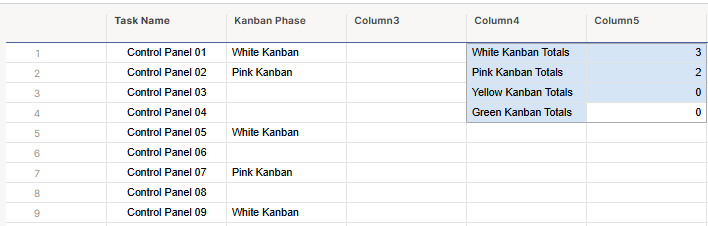
Picture 1: This is how all of my colors originally showed after populating values

Picture 2: This is what it should look like and what I assigned them after picture 1.

Picture 3: This "3" here should be orange but it auto defaulted to blue.

Any help would be greatly appreciated it, I am at a total loss on what to do at the moment.
Thank you.