I am starting a project using a smartsheet template, and the template assigns different colors to different Phases of the sample project. See attached image- Phase 1 is gray, Phase 2 is green, Phase 3 is blue, etc.
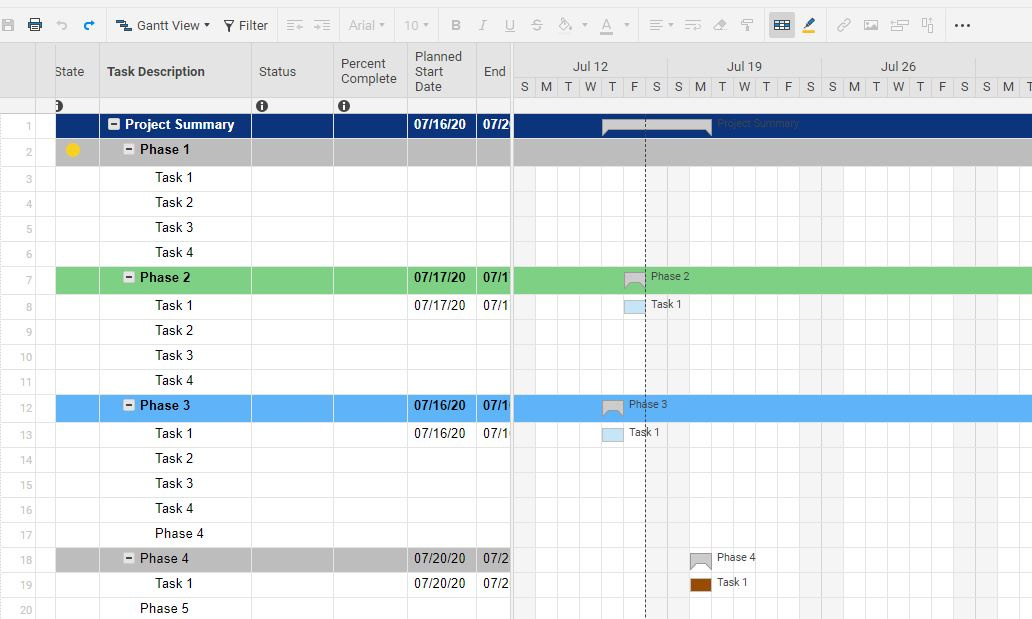
These colors extend through to the Gantt chart view as well. However, when I tried to add a phase I could not find how to add a color to that phase row in the Gantt chart. So I would like to either add a row color for a new phase or edit the colors for the existing phases, etc.
Any ideas how to do this? Thanks in advance for any advice.


