Hi There!
I am trying to track and present progress on key milestones made by multiple countries to share with our donor.
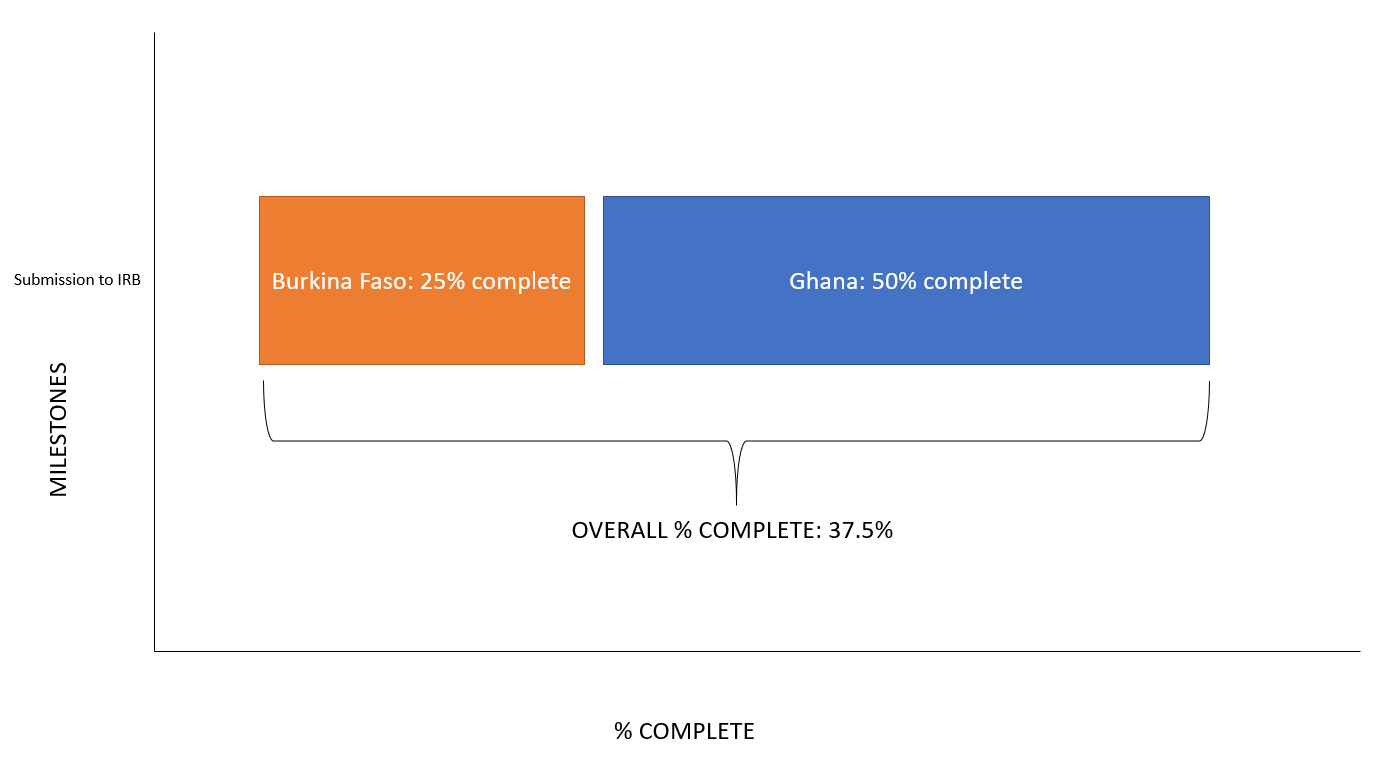
I want to be able to show the average percentage completed overall for the milestone, but comprised of that show the individual country-level progress.
When I try to stack the bar chart of % complete, it adds the country values together rather than averaging them. Is there a way to do this with averaging rather than adding?
Here's what I am trying to create.
Thanks for your help!


