Roadmaps are a great way of communicating important milestones on a project. While Gantt charts and calendars are great, they frequently can be overwhelming, cluttered, and difficult to parse. This can be frustrating for a stakeholder.
When it comes to designing a perfect dashboard, one rule of thumb is that a viewer should gain valuable and useful information within 5 seconds of visiting. A Gantt chart and calendar fall way short of providing valuable info in a short amount of time.
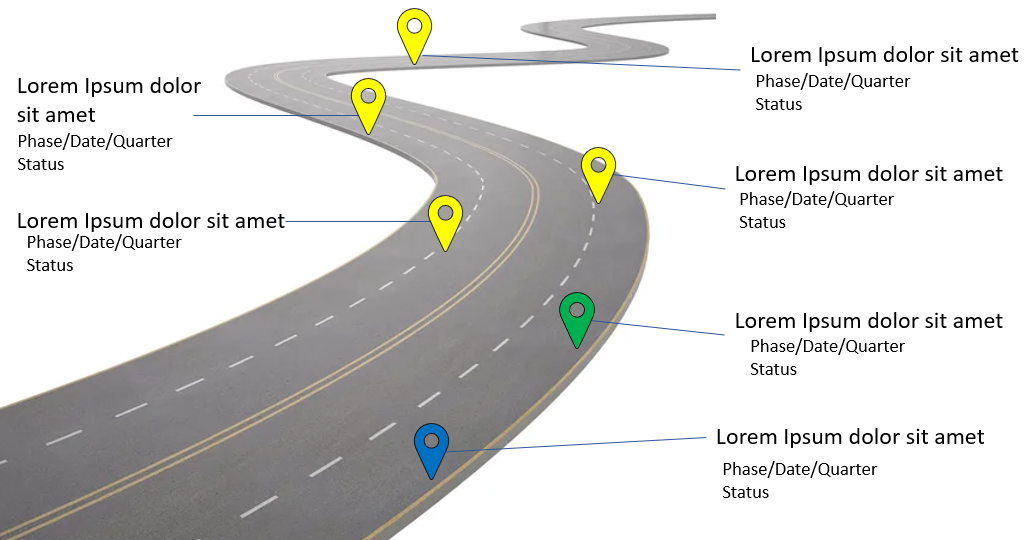
In my organization we like to use a roadmap infographic (see attached image). It's a simple image of a road with points called out along the length of it. Markers are also color coded to reflect the status of the work. It's a quick and easy way to see where exactly we are on the project, and is loved by many of our executive stakeholders.
It would be nice to have a sheet that contains the title, phase number, start/end dates, status and have that populate into a predesigned infographic. That way, I can simply update the sheet and the widget would automatically update.