Hi,
We have been pining after graph functionality for a while in smartsheet and thought the latest release may have addressed this.
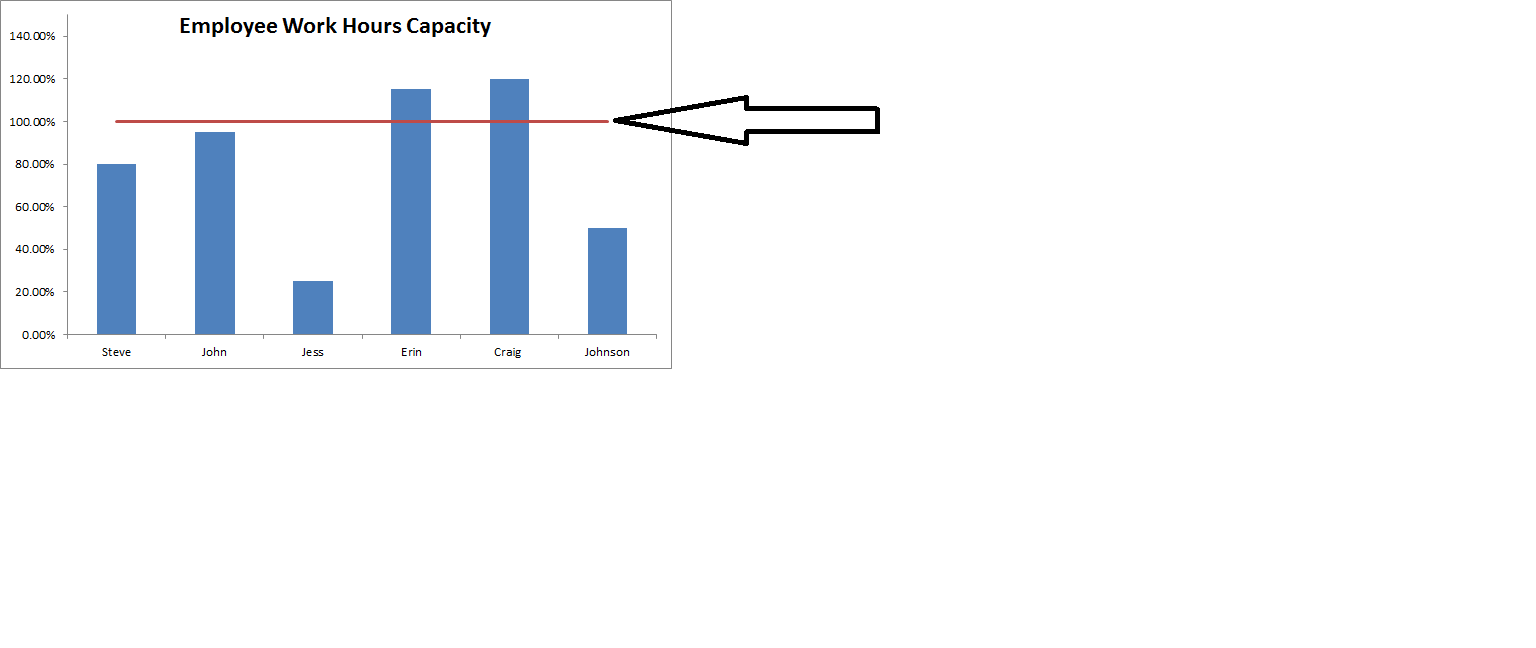
Could anyone suggest a way to address the following (please see attached picture)
We would like to add a target line to a bar graph to visually see where employees are over allocated.
The picture attached was made in excel but demonstrates what we would like to do in smartsheet.
Any suggestions?
Steve