Hello,
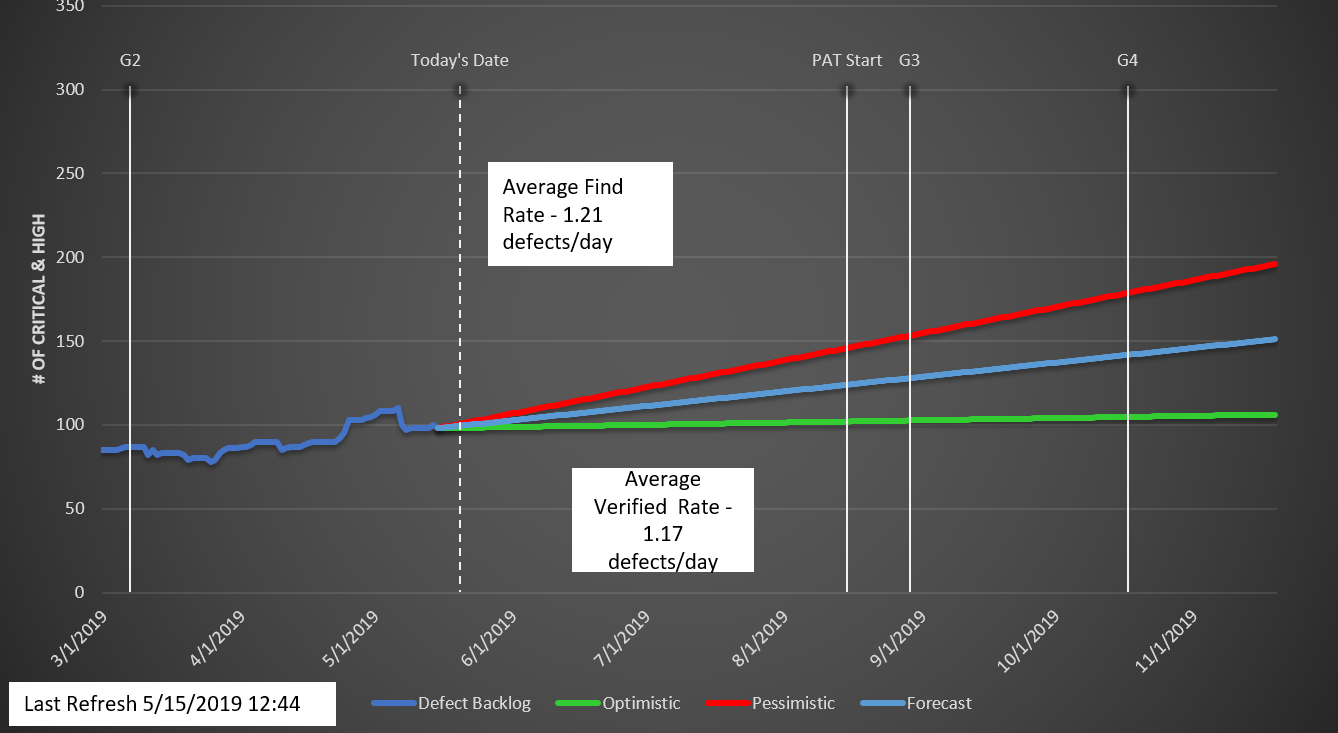
I'm a bit stuck on how, if it is even possible, to create a burn down chart. I'm importing raw data from Jira (we don't have the plug-in... yet) and we want to show a burn down of our defects backlog, along with optimistic and pessimistic and forecast. I'm able to do it in Excel so I've attached an image of something "similar" we'd like to do on a dashboard in Smartsheet.
I've already tried to create a separate spreadsheet with metrics and I tried creating a report but not sure how to even organize the data, if I can.