I suggest creating a network diagram view to visually see critical chain tasks.
Sign in to see the current vote count, add your own vote, or leave a comment.
Hi, I was using a lot the relationship diagram in Microsoft project, to visualize dependencies. Is there a plan to implement something similar ? See screenshot below, the relationship diagram would show what is before and what is after the selected task, allowing to easily view dependencies along with their row number. Very helpful on a big project.
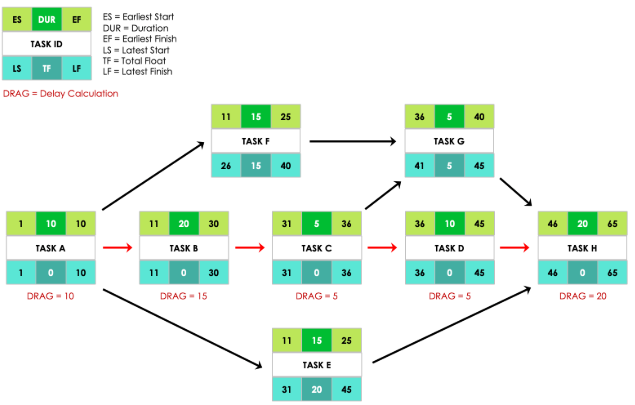
We would like to have a PERT Diagram view in Smartsheet. This diagram allows to have a visual representation of the tasks, their dependencies, and the calculation if the Critical Path.
The ability to add/edit tasks and dependancies in this view would be very helpful. Currently we use other software for network diagrams and transcribe them into Smartsheet.
Even a simplified network diagram view (task, duration, total float) without the additional calculations would be helpful.
Problem Smartsheet environments quickly become cluttered with inactive Sheets, Reports, and Dashboards that are no longer viewed or updated. This creates confusion for users and significant overhead for admins, especially in large or regulated environments. There is currently no native way to automatically identify, notify…
Having the ability to auto-resize the Calendar App view based on the widget size is needed. We have a "Due in 7 Days' calendar for our dashboards and would like it to be anchored at the top right. Unfortunately, as currently designed, the calendar takes up a significant amount of space and must be moved to the bottom.
I am loving the capabilities in Global Updates under Control Center.However, there are some gaps I would really like addressed.Can we please create a Global Update option to do the following: Update a column formula not just a cell formula Update an automation Note: I know that I could create a new column and delete the…