I have a project where a group of users can submit a smartsheet form at any time to request a new enhancement to one or more of 3 tools. One of these tools is managed by an outside vendor and therefore management wants to be able to track number of enhancements submitted to them as well as how they progress through status changes week over week. They don't necessarily want to see individual line items, just counts.
To avoid having to do a weekly snapshot and manually pull out this data, I have been playing with using a separate sheet to pull in information but maybe I am overthinking it because for the life of me, I can't figure out how to get this to display correctly.
The below screenshot is from pulling versions from the google sheet shared with the vendor, copy pasting those into separate tabs by week and status, and then creating a Summary tab - that takes a LOT of time, but is what management wants to see:
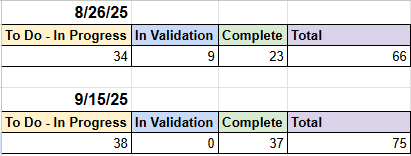
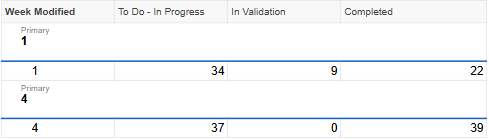
The above is showing that although the 9 items in Validation either moved forward to Complete or back to "To Do" because of bugs found, and other items moved to complete as well, there are still MORE items in that first column due to new requests being added.
This is the information management wants to be able to have visibility into and I would like to be able to programmatically pull that and display it on the project Dashboard.
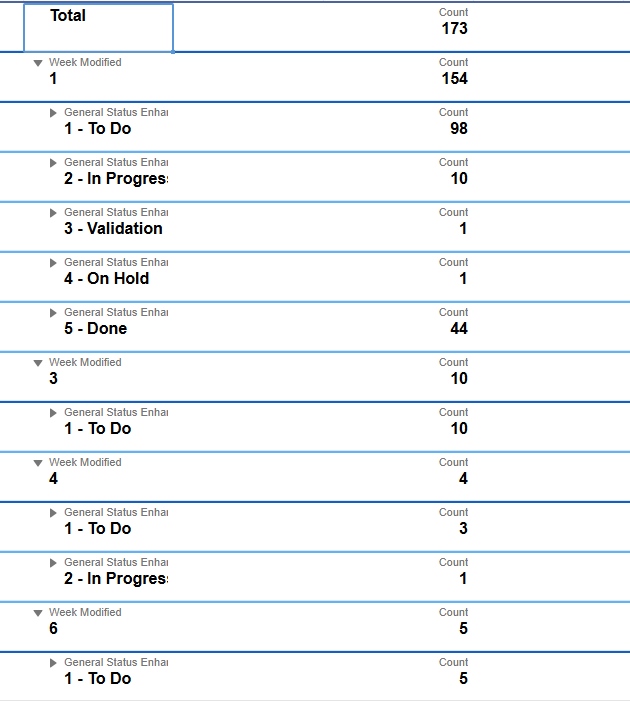
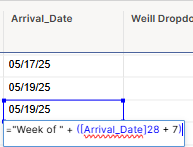
I have a folder of "test" sheets and have so far tried using "Copy Row" into a new sheet when status changes, to be able to count by the created by date on the new sheet, but then wasn't sure how to pull that into a report that pulls by week. I have also tested out having a separate sheet to do COUNTIFS - to count statuses based on Created by date in the original sheet, but I need the data for each week to include what happened before as well.
Is there a way to do this that won't require all the export, copy paste stuff?
Thank you!