Hello Community,
As the newest view on the block and the modern evolution of grid view, table view continues to undergo a steady drumbeat of enhancements prioritized based on your feedback. You spoke, we listened, and now we’re excited to share a collection of new and improved features that work together to deliver a better work management experience in table view. Many enhancements bring the best of grid into a refreshed, table experience, while others introduce entirely new capabilities available only in table view.
And this is just the beginning. Many more enhancements are already in progress as we continue to invest heavily in making the table view smarter, faster, and more capable. Check them out below:
New capabilities available only in table view:
Performance improvements (new!)
We’ve upgraded table view to a new high-performance rendering engine, which significantly improves scrolling, editing, and overall responsiveness. Early results show that 90% of sheets now scroll at ~80 frames per second (fps), which surpasses the industry benchmark of 60 fps and is dramatically faster than before. You’ll also notice quicker loading, smoother cell edits, and generally more responsive interactions. This represents a significant step forward in our ongoing effort to make the table view even faster and more reliable at scale.
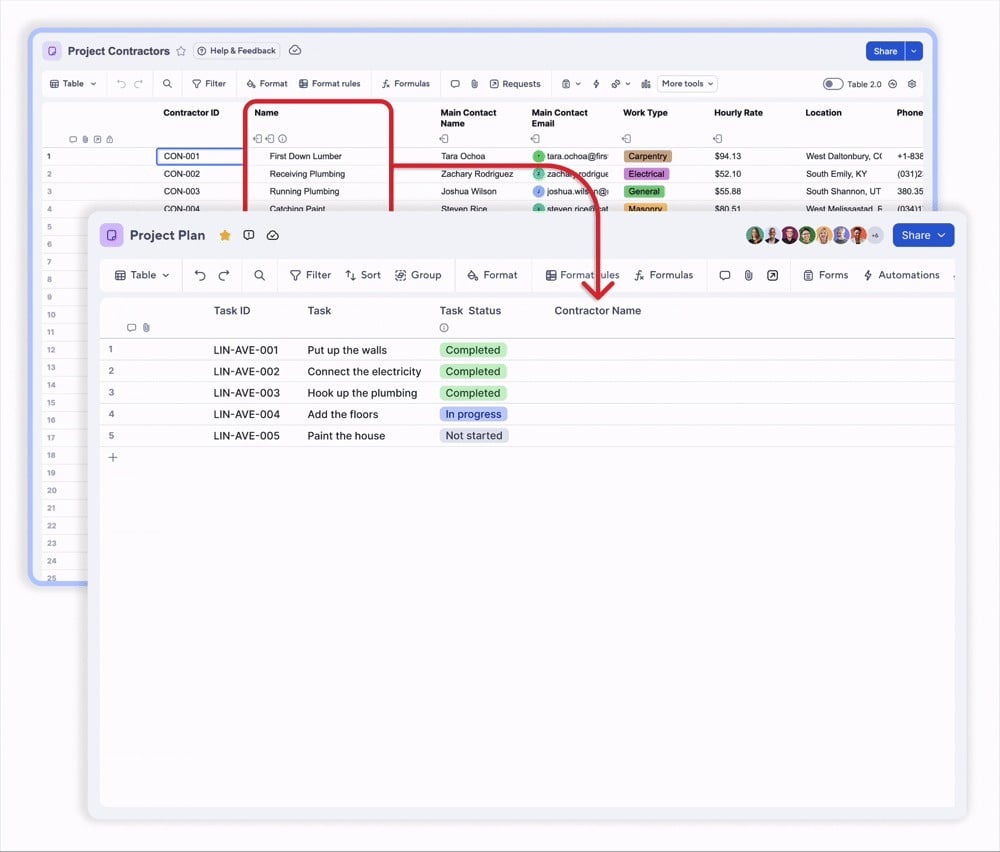
Linked dropdown columns
Now, you can keep the dropdown lists across multiple sheets in sync by linking the dropdown column in one sheet to values stored in another sheet. Whenever the source list updates, connected sheets update automatically, helping teams maintain accuracy and consistency at scale. This is the first phase of the highly requested dynamic dropdowns feature.
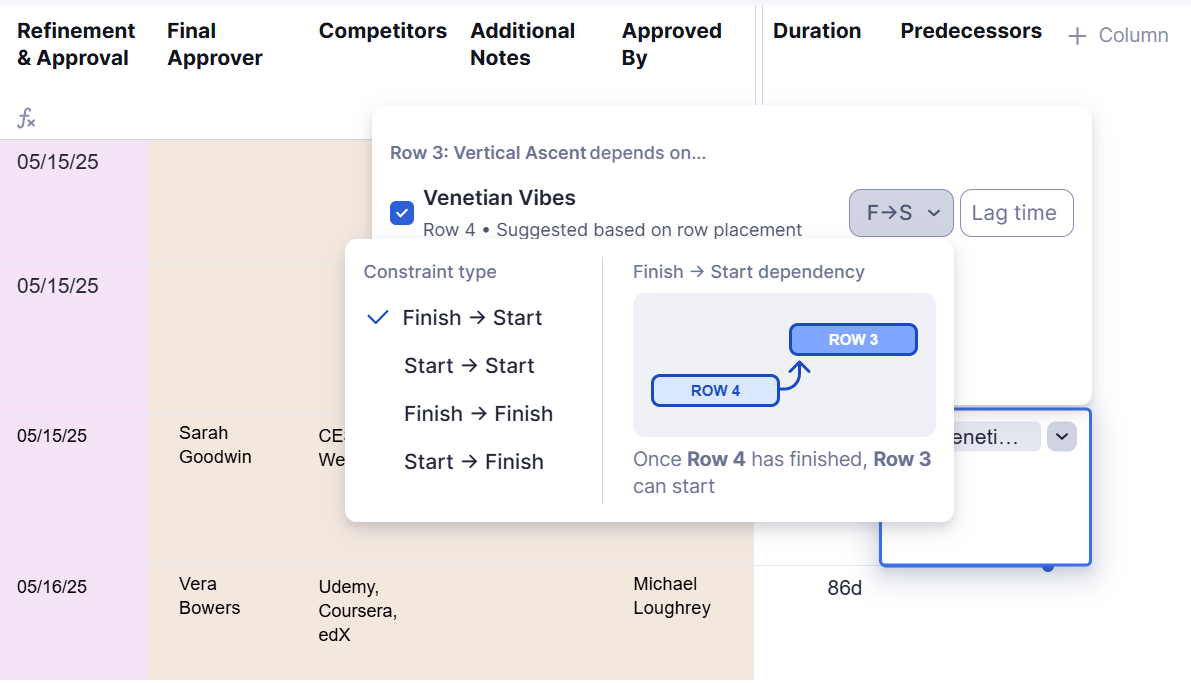
Intuitive dependency management
You can now manage task dependencies, including duration, date ranges, and predecessor relationships, directly in table view. That’s not all! Table view also provides auto-suggested predecessors and visual cues for advanced predecessor constraints, such as Finish→Start (FS) or Start→Start (SS), helping you anticipate downstream impacts and avoid risks.
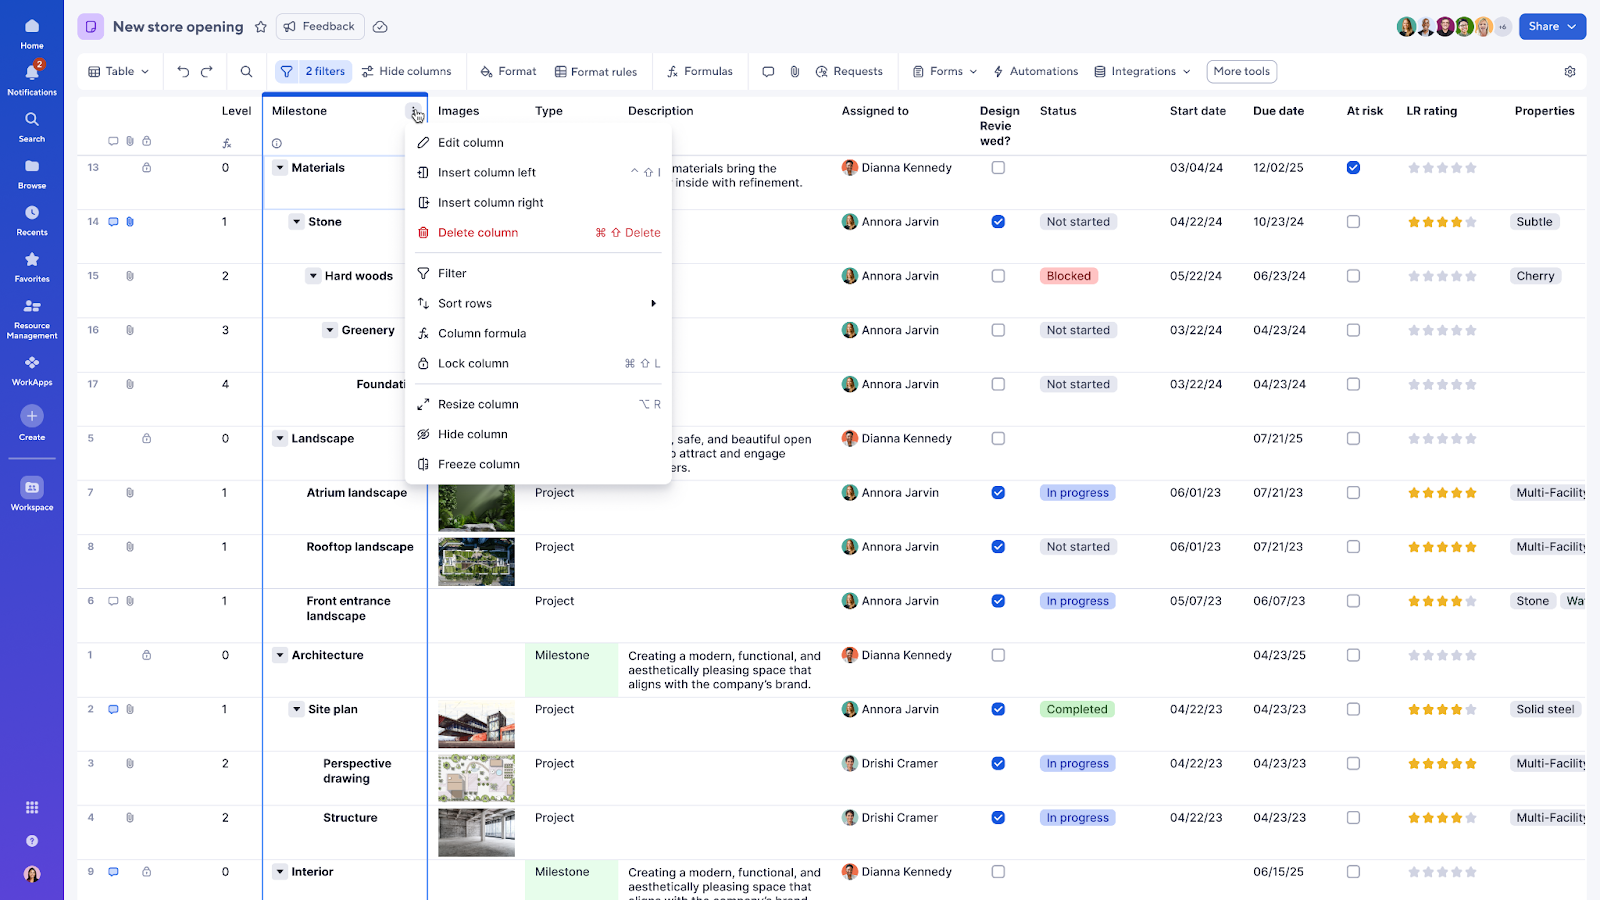
Contextual filtering and (personal) sorting
This update makes organizing and analyzing information in a sheet more intuitive, accessible, and efficient in table view. First, right-select the column header or click the three-dot menu on its far-right side. Then you can use the column context menu to:
- Add or edit filters
- Sort columns alphabetically, by newest/oldest, ascending/descending, etc.
- Clear sorting on individual columns or remove all sorting from the sheet
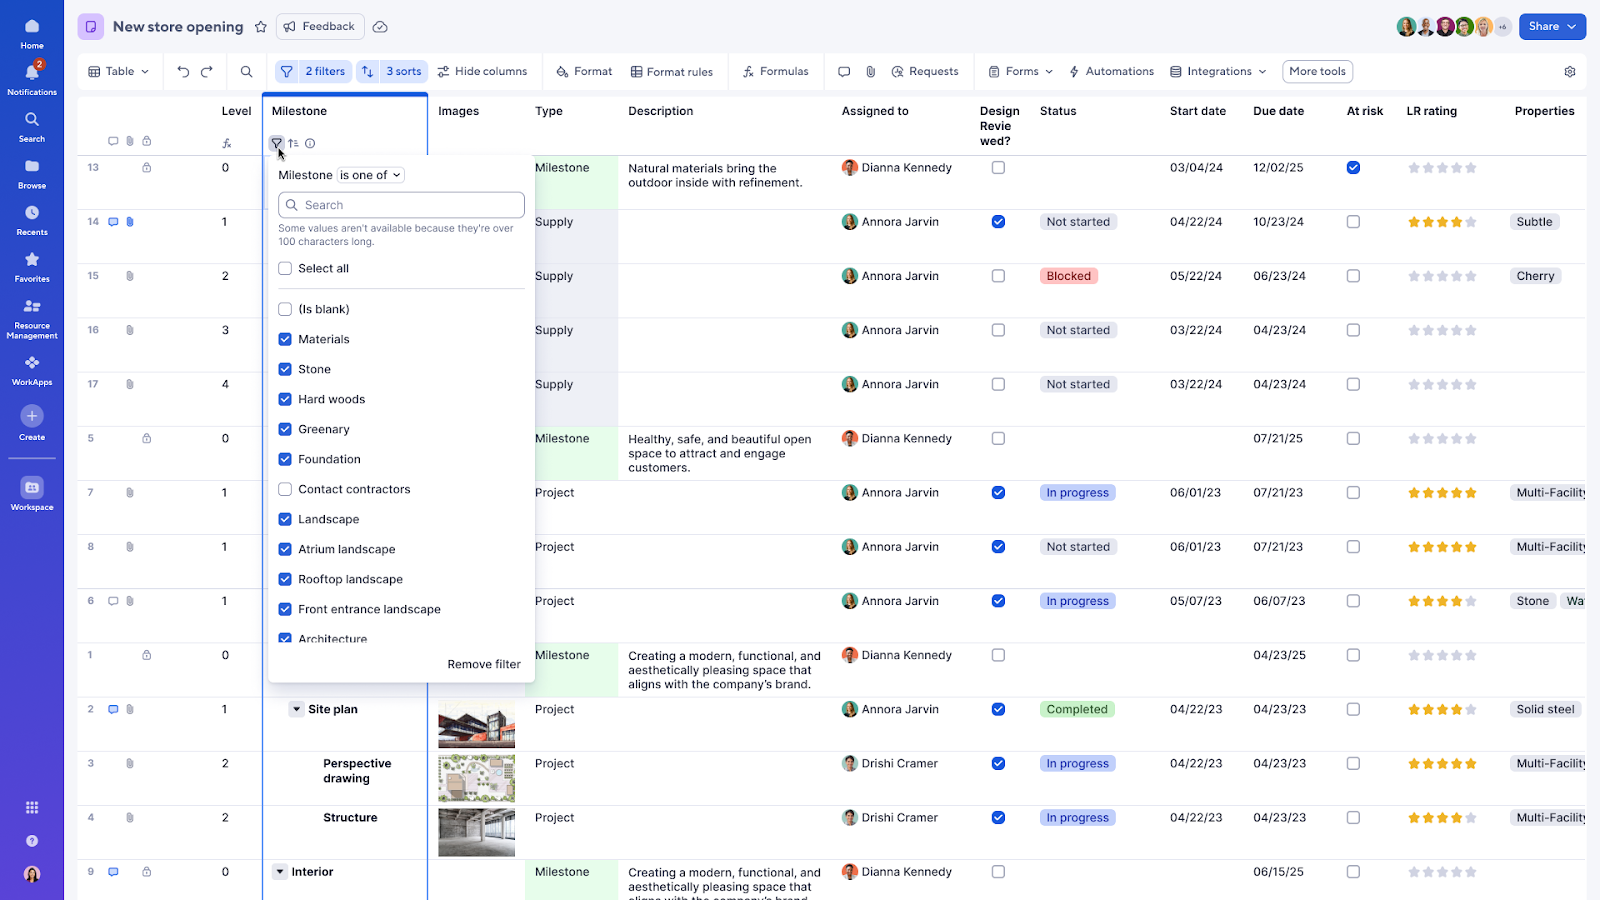
Sorting in table view now applies only to your personal view and does not change how others see the sheet. Sort from the column menu, use the indicator icons to update or clear sorts, and independently explore your data without affecting collaborators.
But that’s not all! We’ve also introduced the ability to update filters and sorts from the column indicator icons on column headers. These icons make it easy to identify which columns have filters or sorting applied, and selecting them immediately opens the relevant filter and sort menus for quick adjustments.
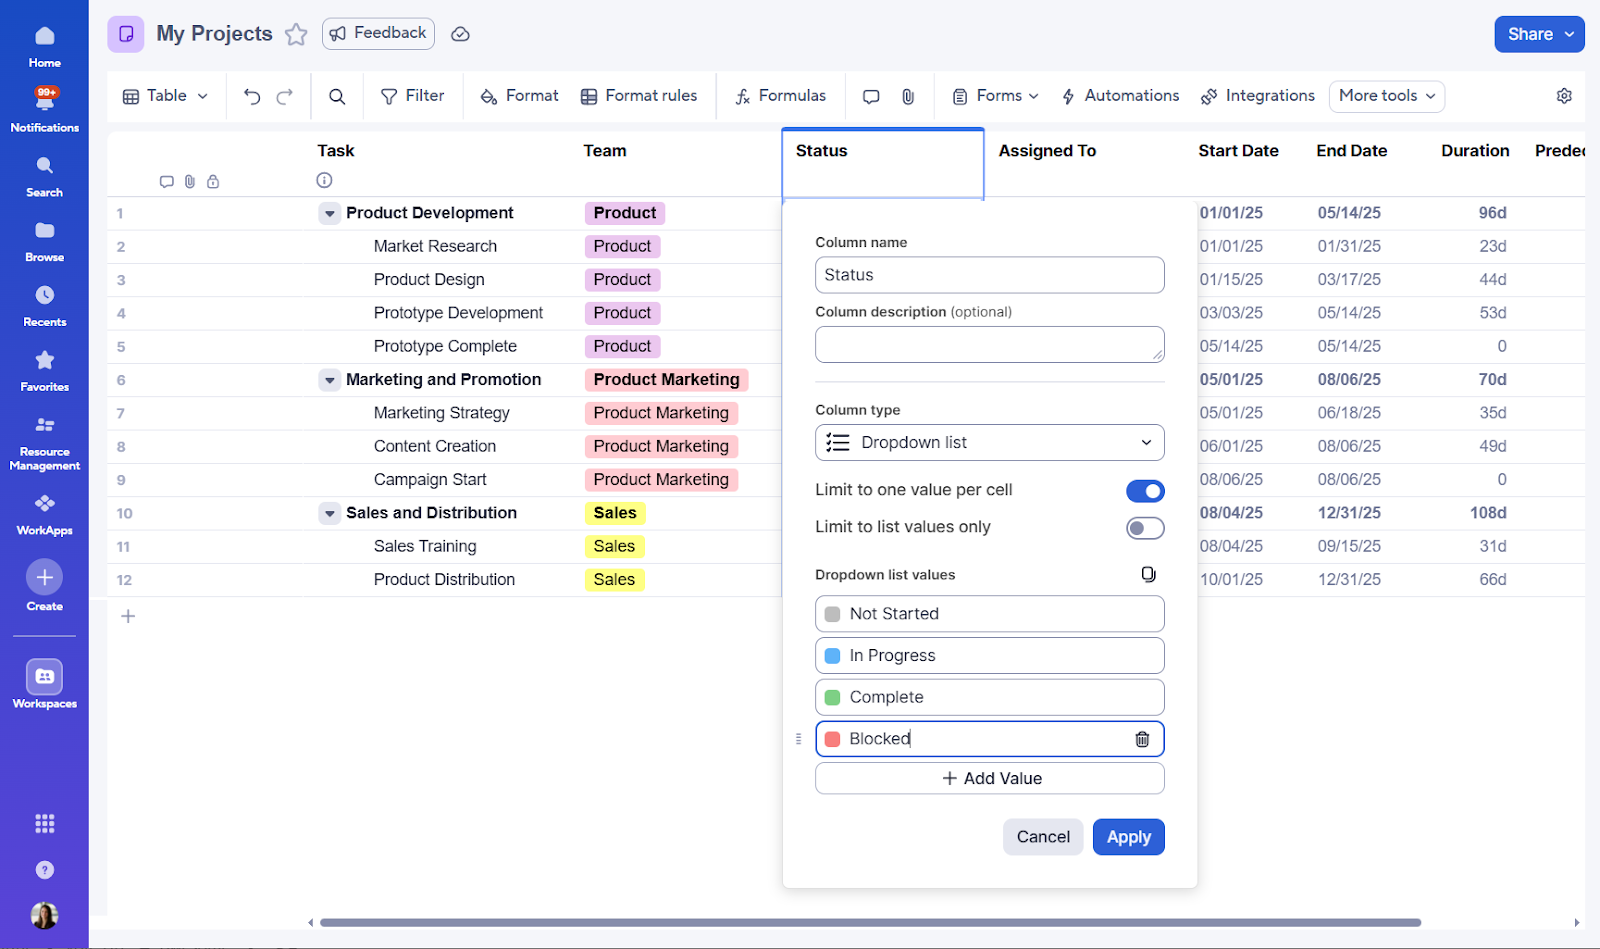
Colored dropdown values
By applying color to dropdown values, you can quickly visualize key information in your sheet at a glance without having to manually configure multiple conditional format rules. For example, previously, you may have had to create three separate conditional formatting rules in grid view to highlight the values of a status column in different colors. Now, you can do it all in one go in the column creation menu of the very same status column in table view. This feature is only available in new views and can also be configured in the lane headers in board view.
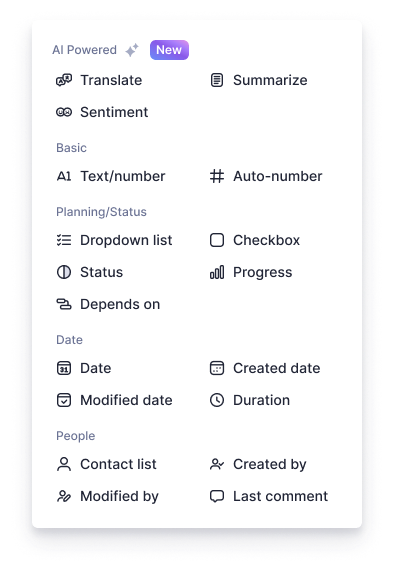
Enhanced column creation
Creating columns in table view is faster and easier than ever! Previously buried under a discrete dropdown menu, all available column types are now conveniently displayed upfront and intuitively grouped by outcome type. For example, if you’re trying to track who last modified a row, simply jump to the People section to find the relevant column type: Modified by.

[COMING SOON] Smart columns
Soon, you will be able to use AI to summarize and categorize sheet content with fewer errors and manual effort. Choose from “summary”, “translate”, and “analyze sentiment” column types to structure your data more effectively and automatically extract or generate the right information in real time.
- Summarize: Summarizes the data in one or more columns and updates as data changes
- Translate: Translates a column from one language to another
- Analyze sentiment: Analyzes if the data in a row has a positive, neutral, or negative sentiment
Popular grid features, now in table view
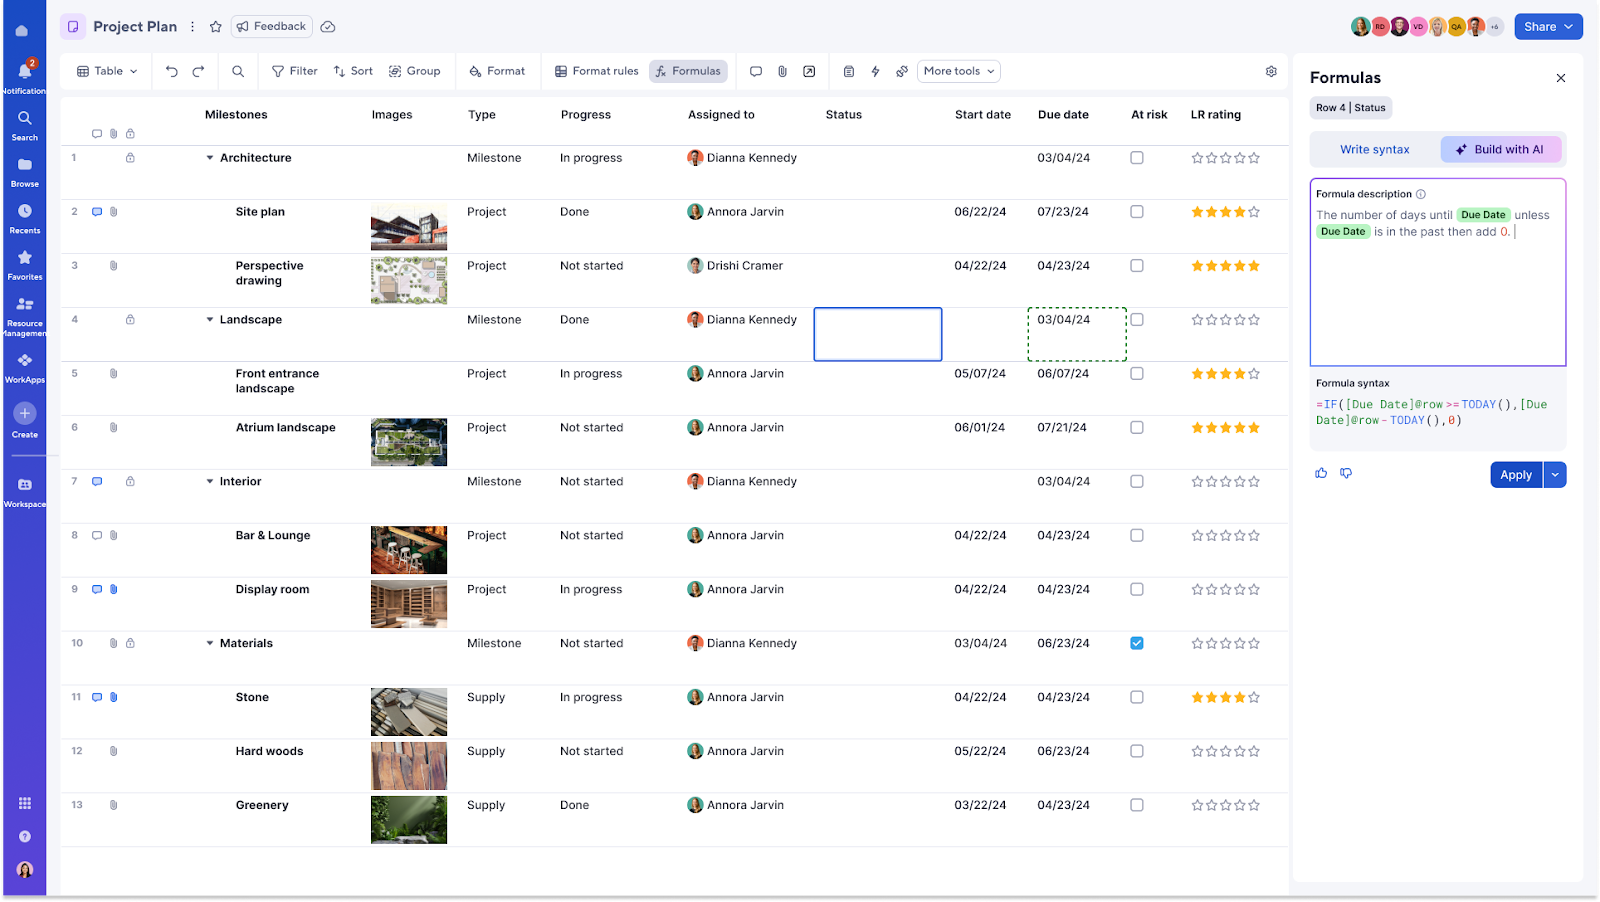
Generate formulas with AI
Use AI to quickly create working formulas in table view, no complex functions or syntax necessary. Simply describe what you want the formula to do in plain language in the formula panel, and AI will generate it for you, complete with column references.
Below are a few example prompts to try. Be sure to enter your desired column names inside the brackets:
- Figure out gross profit margin using [price column] and [cost column]
- Count the total number of rows where the [checkbox column] is checked
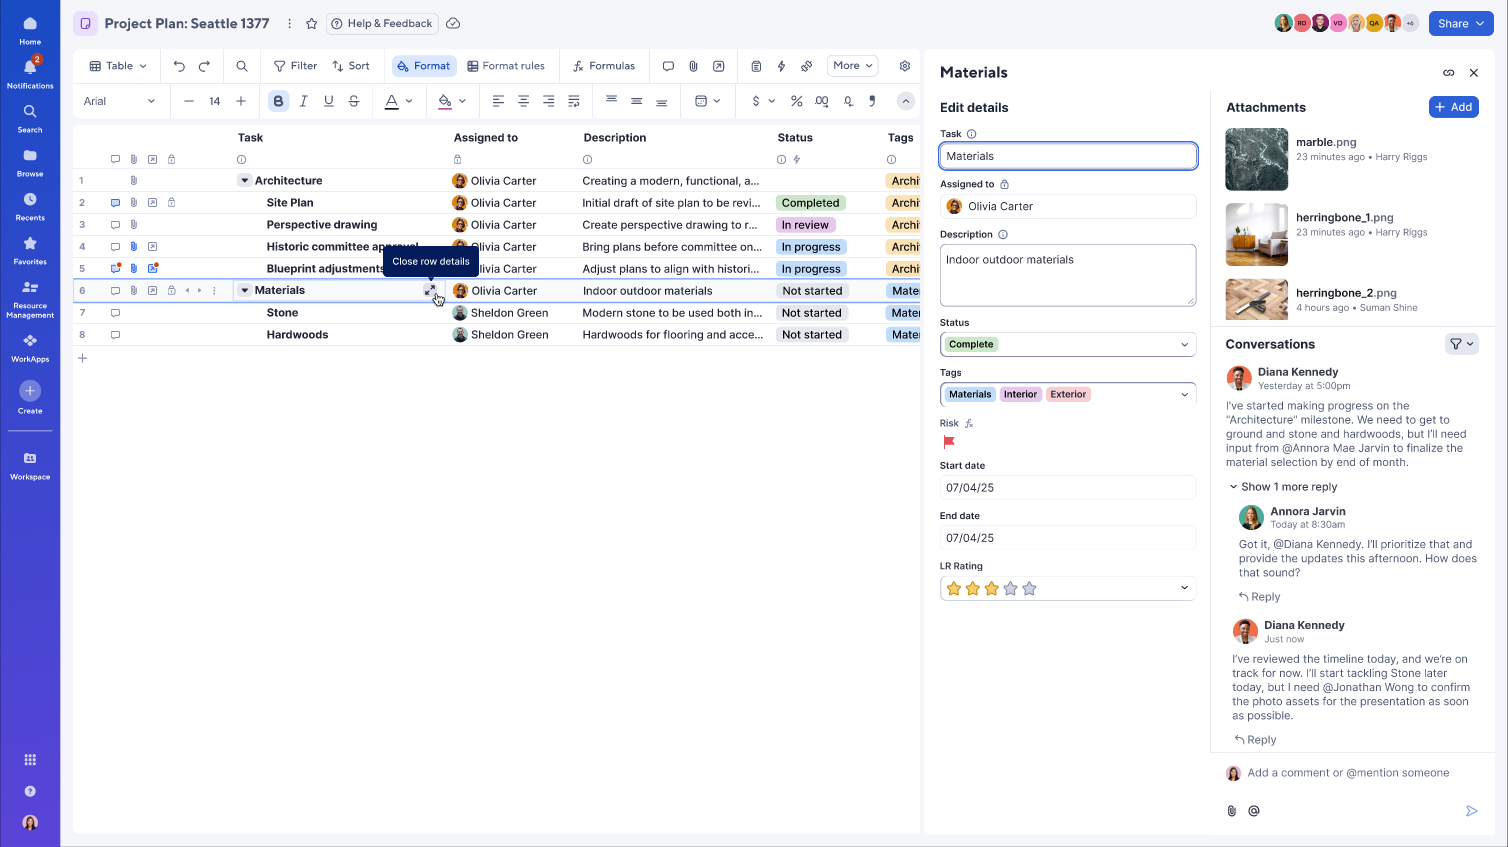
Improved details panel
You can now edit multiple fields, comments, or attachments for a row in one place, without unnecessary scrolling, with the updated details panel. This is especially helpful for managing data in sheets with a large number of columns.
Autocalculation bar
It’s now possible to glean insights from a sheet in table view without having to manually create new formulas. Select your desired cell or column range and instantly view relevant calculations in the bottom-right corner of the sheet.
- COUNT, SUM, and AVG for ranges that include at least one numeric value (e.g., calculate average task duration or total budget)
- COUNT, MIN, and MAX for ranges that include at least one date and no numbers (e.g., identify the earliest delivery date)
- COUNT for ranges that don’t include numbers or dates (e.g., count how many rows fall under a parent task)

Sheet settings panel
In addition to enhancing table view, Smartsheet continues to roll out improvements to our other new views as well. The latest update to the Settings panel makes it easier to review, manage, and update all sheet settings in table, board, and timeline views.
Start by clicking the gear icon in the top-right corner of the toolbar to access the Settings panel in your chosen view. From there, you can set and manage start date, end date, dependencies, and % complete for the sheet. It’s also possible to set the start of the fiscal year and the day of the week, as well as configure working/non-working days.
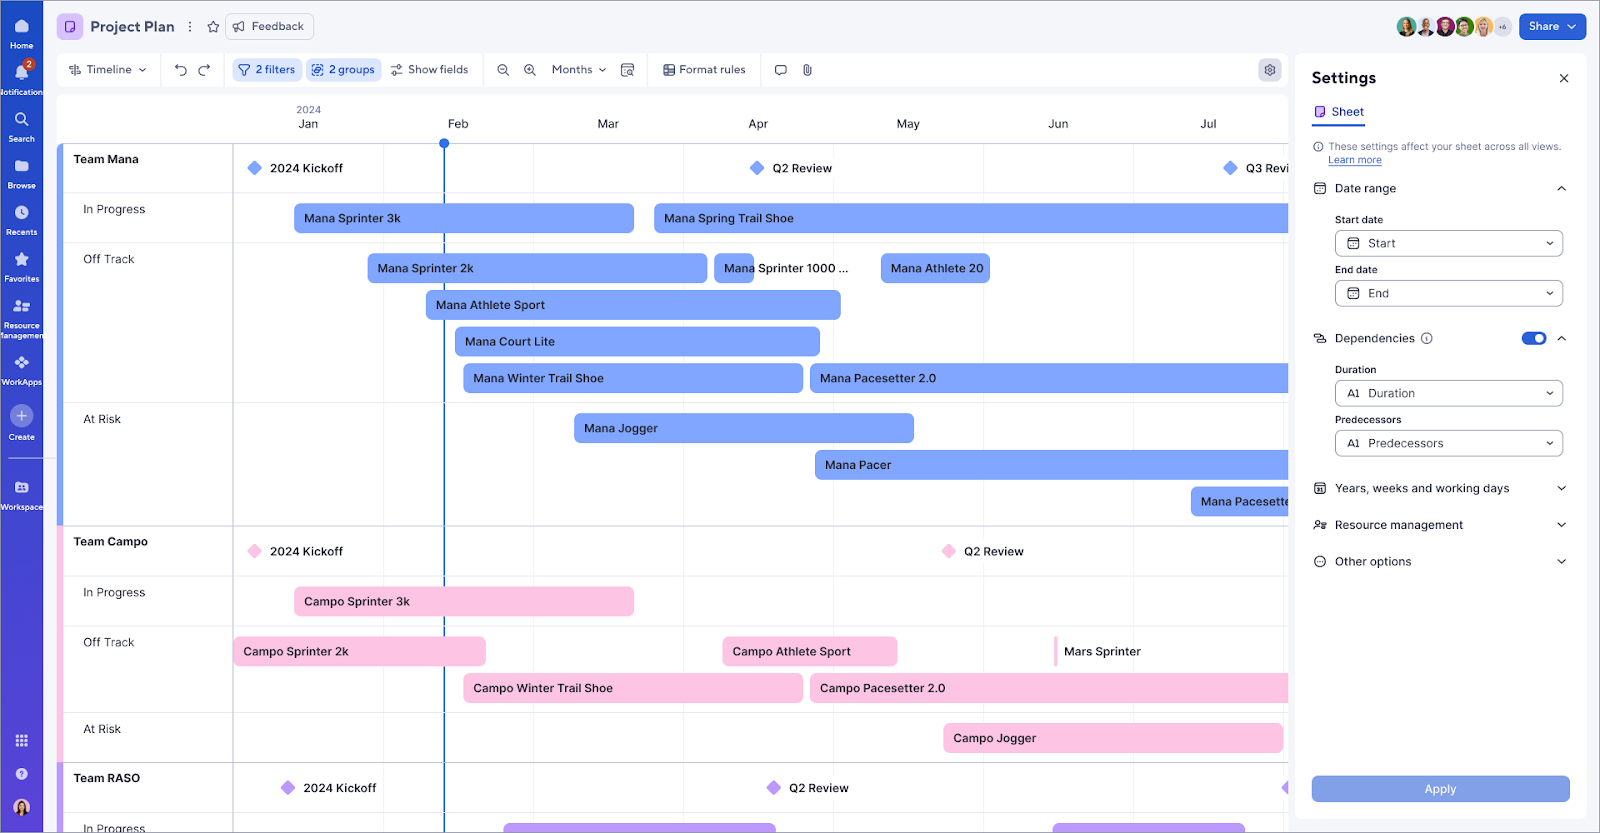
Please note that the ability to configure resource management settings in the Settings panel is not included in this release.
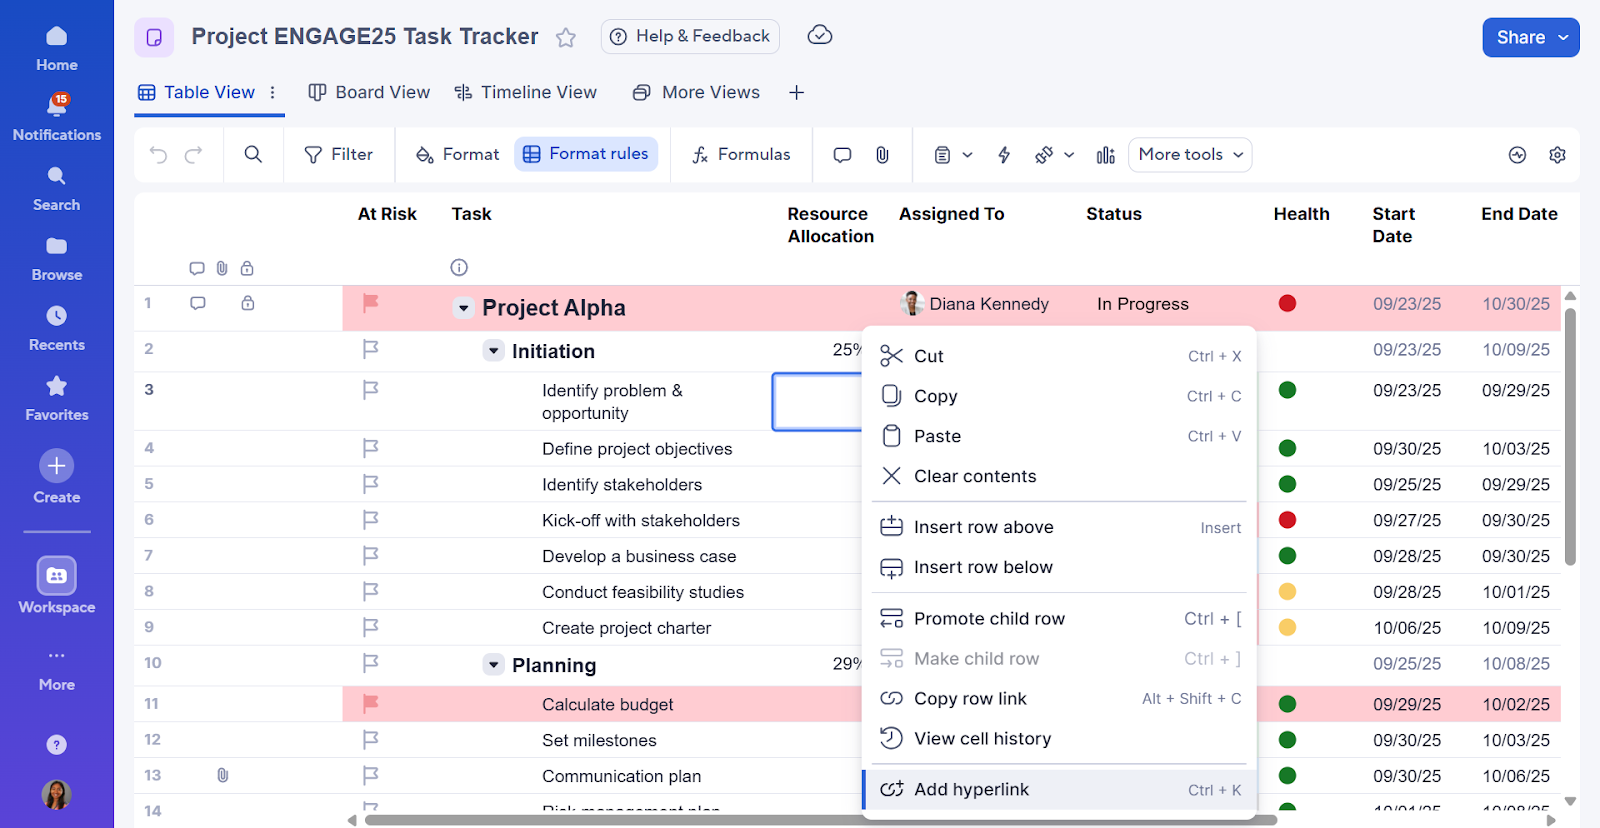
Cell hyperlinks with custom display text
It’s now possible to create, edit, and remove cell-level hyperlinks directly in table view. Whether it’s a link to another sheet, dashboard, report, or external URL, this update enables teams to easily connect related resources and gives collaborators quick access to key content. To add a hyperlink, right-click the cell and select “Add hyperlink” in the cell context menu, or simply use the CMD/CTRL + K shortcut keys.
Cross-sheet formula references
Cross-sheet formula references are coming soon in table view! This update will make it easier than ever to manage complex projects and reference values across multiple sheets, enabling you to run formulas that consolidate data, calculate key metrics, generate portfolio-level roll-ups, and more. Add references to cells or ranges in external sheets directly, as well as edit existing cross-sheet references, all in table view.
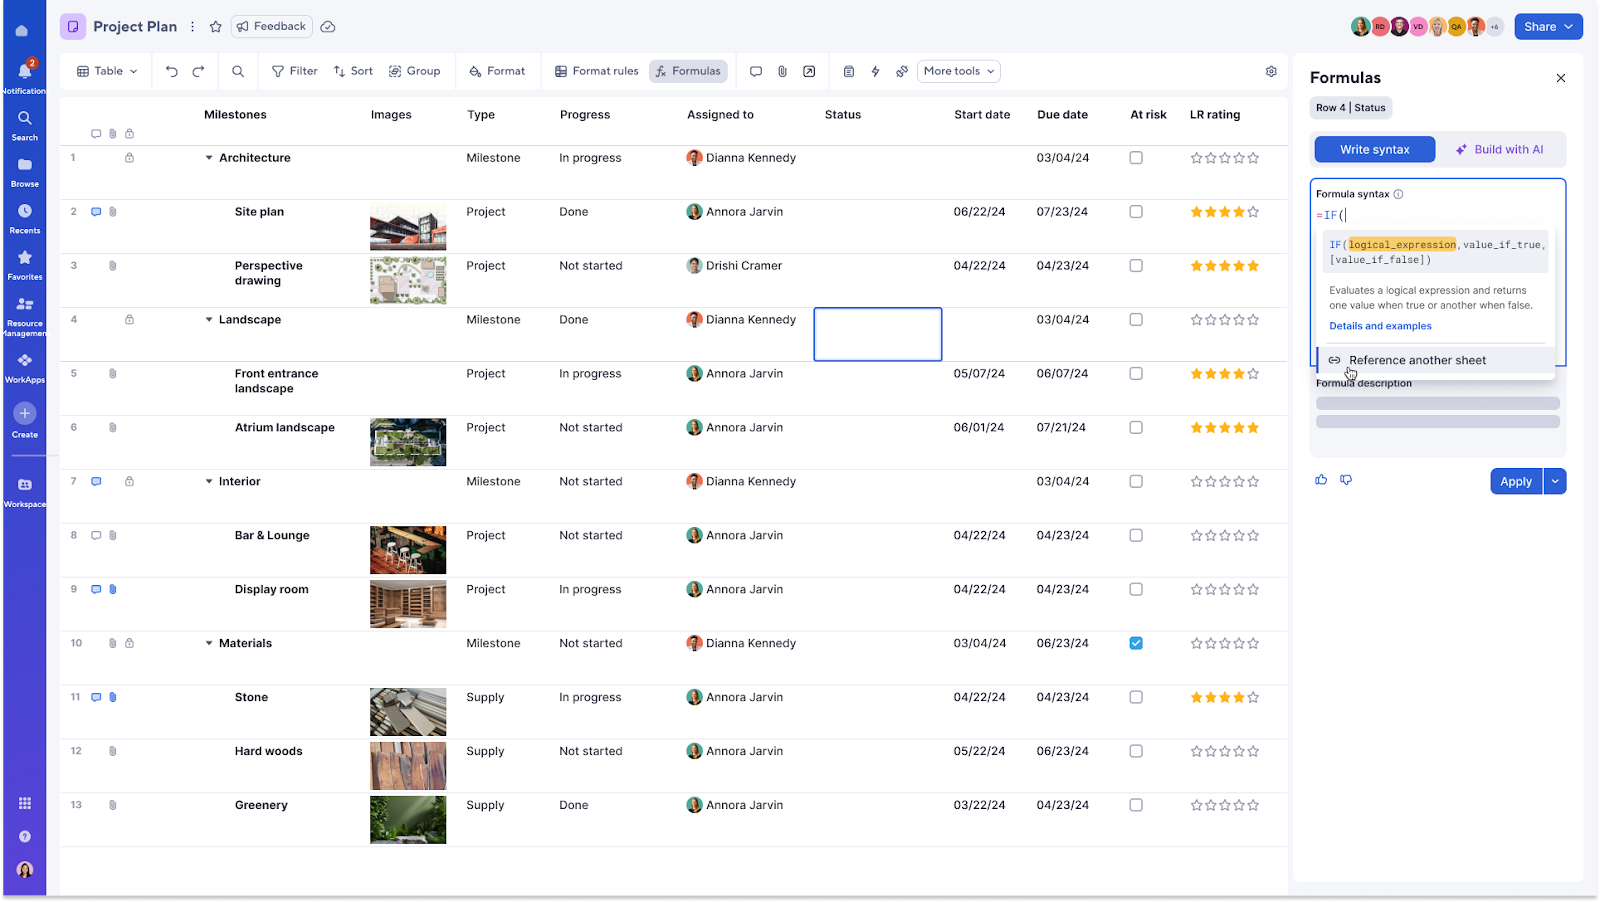
Please note that this initial release does not include quick access to recently referenced sheets in the sheet picker, custom naming of cross-sheet references, or autocompletion of reference names when typing. However, these features are currently being considered for future updates, so stay tuned!
Move and copy rows
Users will be able to seamlessly transfer information and maintain consistency across connected sheets, streamlining their workflows and keeping data organized. Previously available only in grid view, this functionality will allow users to:
- Select “Move row to another sheet” from the row context menu to relocate rows and maintain a clean, structured dataset
- Select “Copy row to another sheet” to duplicate rows while preserving the original data
- Choose the destination sheet for the move or copy action to ensure rows go exactly where they’re needed
- Decide whether to include attachments and comments when copying rows, providing total control over what information is carried over

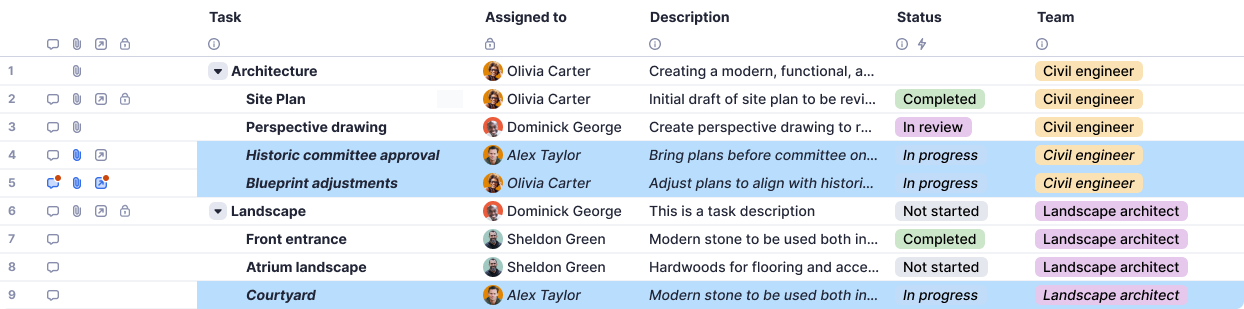
Conditional formatting
Conditional formatting will allow you to create rules on your sheet to update the formatting of individual cells or entire rows on your sheet when certain criteria are met. For example, if a task is past due, you can highlight it in red and bold to ensure it's quickly noticed. Or you can highlight “in progress” tasks in a blue background and italicized text.
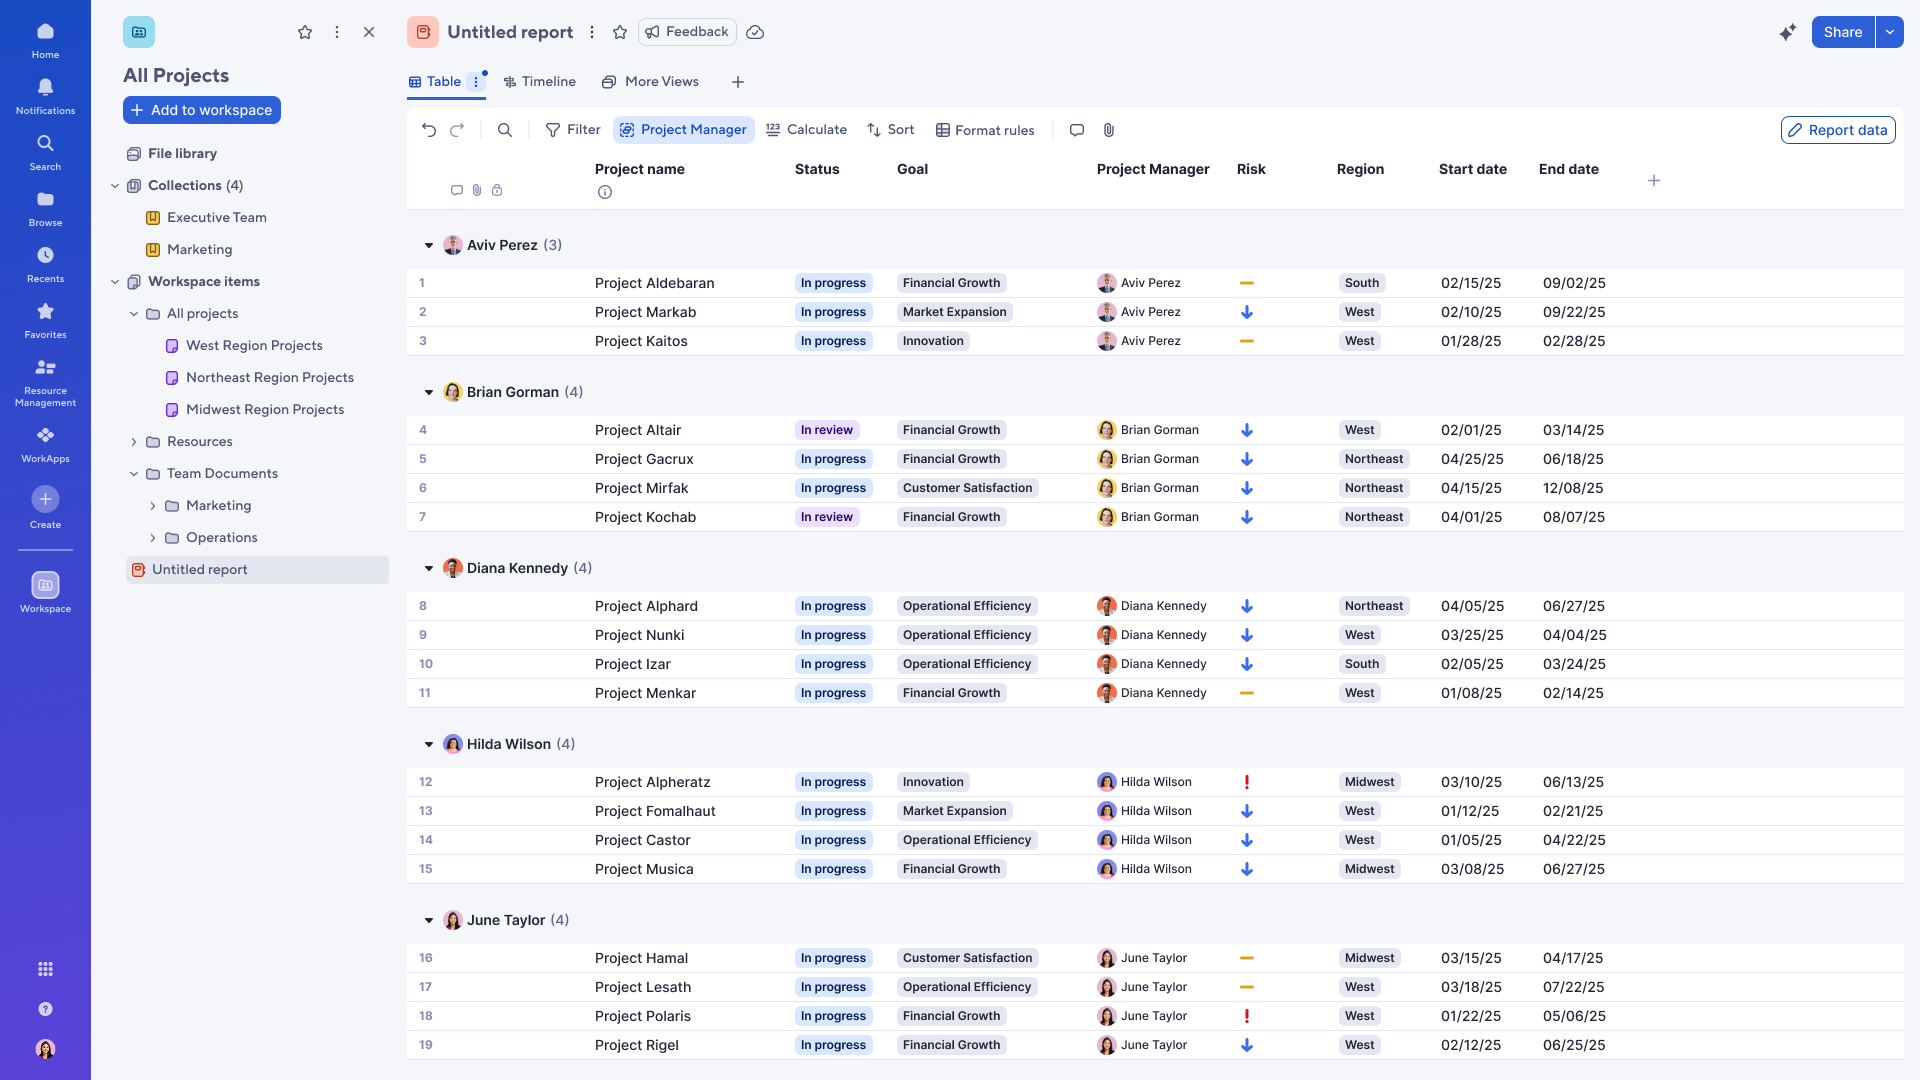
[COMING SOON] Table view in reports
Users will soon be able to view their reports in table view. Whether it’s a single-sheet or multi-sheet row report, you can now view your work in a more modern table experience. Join the EAP to get early access to table reports.
Stay updated
This post highlights only a portion of what we’re building for table view. We have a robust roadmap ahead, with a goal of reaching roughly 95% feature completeness by the first half of 2026. To stay up to date on the latest Smartsheet enhancements as they're released, subscribe to receive weekly product updates in your inbox.
Thanks for being part of the Smartsheet Community!