Hi-
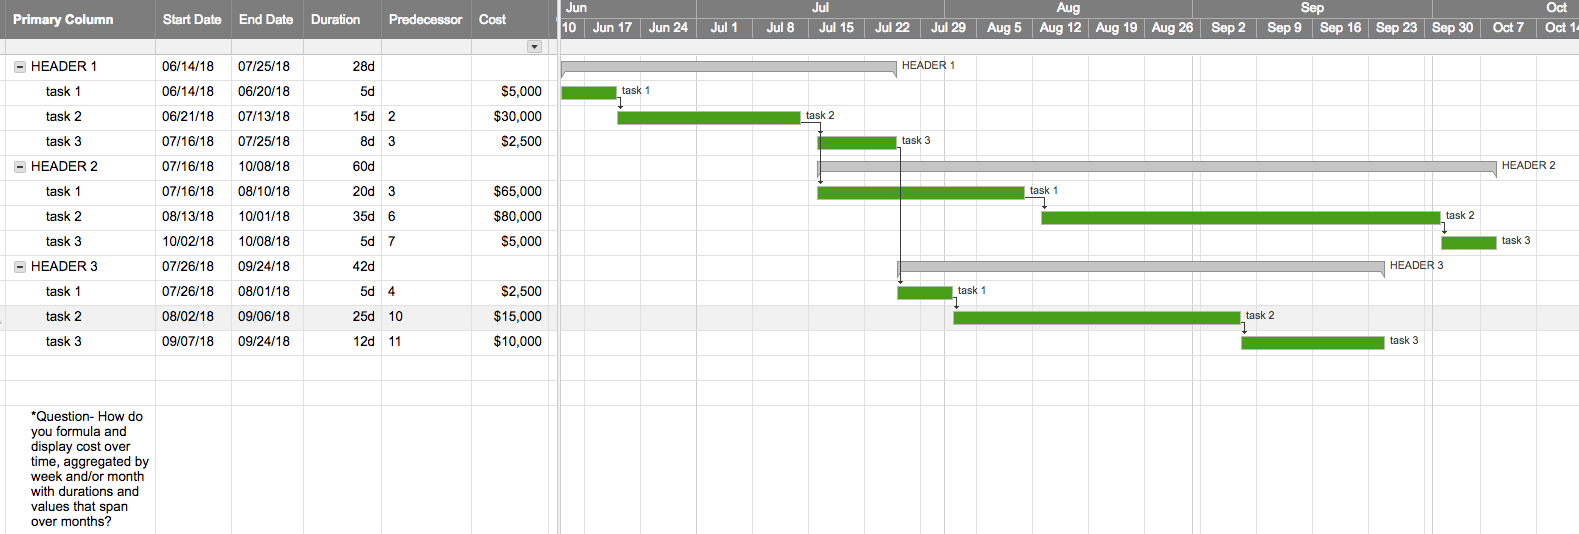
I am trying to either graphically or with subtotals display cost over time as aggregated preferably by month, but also want to consider by week.
I am easily able to plot cost for items that begin or end in a calendar month, but not for items that span months.
I am pretty sure each cost would need to be broken down into a cost/day based on its duration, but am having trouble beyond that to calculate and display over time.
See screenshot for basic setup of what we are looking at.
Intent is to show clients and predict internally projected billings/revenue over time for each calendar month.
Many thanks in advance for your suggestions.
